
Bitcoin Technical Analysis as of March 4, 2025
The market experienced an upward trend followed by a downward shift, with key resistance and support levels indicated. A potential rebound is observed, but caution is advised due to the high market risk.
Article
The financial markets are often characterized by their volatility, with trends that can shift dramatically in relatively short periods. A closer examination of the trends observed from October to early December 2024 reveals significant insights into market behavior that may guide traders and investors in their future operations. Beginning in early October, the market exhibited a notable upward trend, which drew optimism among investors and led to increased trading activity. This period saw an emergence of positive sentiment, resulting in a robust increase in asset prices. As the market advanced, it laid the groundwork for a potential double top pattern—a classic technical analysis pattern that usually indicates a reversal in the prevailing trend. Between mid-November and early December, the market oscillated within specific price ranges, tested the upper resistance levels, and raised concerns about sustainability. However, as we transitioned into February 2025, the market dynamics took a dramatic turn. The optimistic outlook from the previous months was replaced with prevailing bearish sentiments as selling pressure surged. By late February, the downward trajectory had intensified, prompting a reassessment of investment strategies across the board. The increased selling resulted in rapid price drops, contributing to a palpable sense of uncertainty among traders. In early March, there was a temporary upward rebound, indicating that some traders viewed the lower prices as buying opportunities. However, this rebound was short-lived, encountering resistance at previously established highs. These resistance levels—specifically around 98,850 (UTC), 107,770 (UTC), and 110,000 (UTC)—became critical points that traders closely monitored. Breaking through these levels could signal a shift in market sentiment; a failure to do so, however, might reinforce the prevailing bearish outlook. On the other side of the spectrum, key support levels were identified at approximately 91,550 (UTC) and 86,100 (UTC). It is at these levels where a significant number of buy orders tend to cluster, making them crucial for traders. As of now, the current price holding around 86,240 (UTC) suggests that we are hovering near the support level. Should this level be breached, it could trigger further selling, while a bounce back might indicate a potential reversal in market sentiment. The trading indicators give us further clarity into this situation. The MACD (Moving Average Convergence Divergence) indicator reveals some interesting developments—although the market is currently under substantial selling pressure, the downward momentum appears to be weakening. This could suggest a potential rebound might be on the horizon. In conclusion, the prevailing market environment suggests heightened risk, urging traders and investors to exercise caution in their trading operations. While there are opportunities for gains, it is equally important to be aware of the volatility and risk associated with movements in the market. In the coming weeks, carefully assessing both macroeconomic indicators and technical patterns will be essential for making informed trading decisions. As we watch the price action unfold, it is crucial to remain focused on key support and resistance levels, as well as to utilize technical indicators to make educated predictions about future market behavior.
Keywords
 Bitcoin
2025-03-04
Blockenza Analysis
Given the current market conditions, with significant selling pressure and the existence of bearish forces, it is likely that the price may drop further. Thus, the analysis results in a score of -40 reflecting a bearish outlook.
FAQs
1. What trend did the market exhibit from October to November 2024?
The market exhibited an upward trend.
2. What pattern formed between mid-November and early December 2024?
A potential double top pattern formed.
3. What occurred in February 2025?
The trend turned downward, accelerating the decline.
4. Was there any recovery in early March 2025?
Yes, there was an upward rebound in early March.
5. What are the key resistance levels?
The key resistance levels are around 98,850, 107,770, and 110,000 (UTC).
6. What are the key support levels?
The key support levels are around 91,550 and 86,100 (UTC).
7. What was the current price at the time of analysis?
The current price is around 86,240 (UTC).
8. What does the MACD indicator suggest?
The MACD shows that bearish force is strong but downward momentum is weakening, indicating a potential rebound.
9. What can be said about the market risk?
The overall market risk is relatively high.
10. What is recommended for trading in this market?
It is recommended to operate cautiously.
Related Articles
In this section, you will find articles and analyses related to this post. These materials will help you gain more information about the topic and develop a broader perspective on the digital currency market. By reading these articles, you can make more informed and precise decisions in your investment journey.

Revolutionary Move? Deutsche Bank Predicts Bitcoin Strategic Reserve Will Solidify US Crypto Leadership
Deutsche Bank has announced support for Bitcoin, advocating for a strategic reserve that could bolster the United States' leadership in the cryptocurrency sector. This endorsement could lead to broader acceptance of Bitcoin as a legitimate asset and influence other nations to follow suit.
Bitcoin
2025-03-11

Crypto Industry Demands Regulatory Clarity Over Bitcoin Reserve from Trump
Cryptocurrency executives believe that regulatory clarity in the US is more crucial for the industry than President Trump's initiative to create a national Bitcoin reserve. Trump's recent executive order has left the crypto community craving detailed guidance on regulations and taxation, as they faced significant losses amidst macroeconomic uncertainties.
Bitcoin
2025-03-11
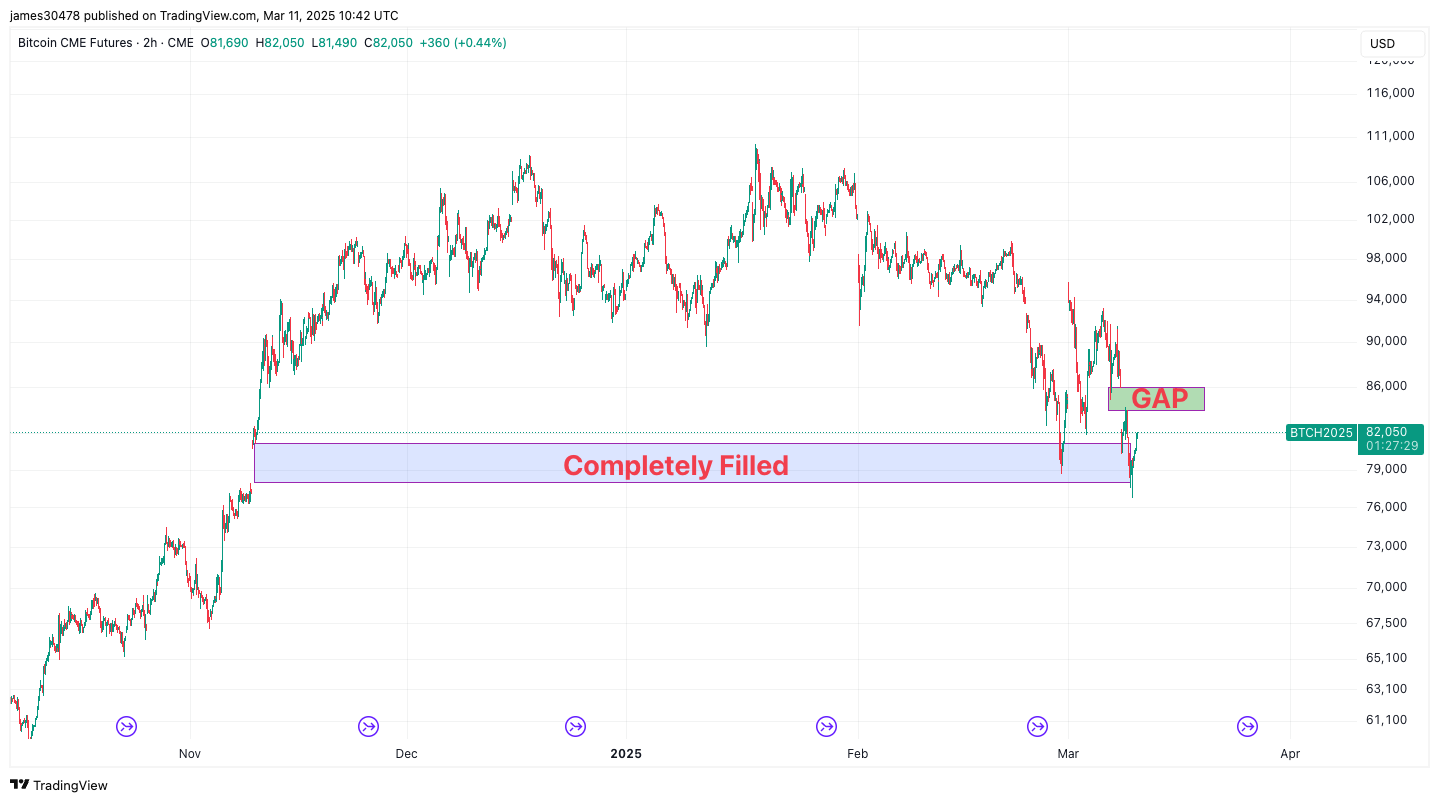
Bitcoin Fills Another CME Futures Gap as BTC Price Drops to $76,700
Bitcoin's price has dropped to $76,700, filling another gap in CME futures, indicating ongoing volatility in the market. Analysts continue to watch for potential short-term movements based on these fills.
Bitcoin
2025-03-11

'Rich Dad Poor Dad' Author Responds to Bitcoin Market Crash: 'I Will Keep Purchasing Bitcoin on Sale'
Robert Kiyosaki advocates for purchasing Bitcoin during its current low prices following a market decline. He views this as a valuable investment opportunity and plans to continue acquiring Bitcoin.
Bitcoin
2025-03-11
Bitcoin Price Falls Below $80,000, Analyst Predictions for the Future
Bitcoin's price has plummeted below $80,000 following days of market volatility, while several analysts offer insights into its future. Additionally, the majority of leading altcoins are also experiencing declines, worrying crypto investors.
Bitcoin
2025-03-11

Market Decline Affects Cryptocurrency Valuations
The cryptocurrency market is facing significant turbulence due to negative sentiments around technology stocks and recession fears, leading to substantial sell-offs, especially impacting Bitcoin and altcoins. Investors are monitoring the situation closely for any trends or cues.
Bitcoin
2025-03-11