
Fundamental Analysis of Bitcoin on February 9, 2025
The extreme volatility of the cryptocurrency market drew significant attention in late 2024, as a specific cryptocurrency surged sharply due to favorable market conditions. This excitement was tempered by caution as technical indicators suggested potential price reversals, leading to a reevaluation of investment strategies by traders amidst evolving market dynamics.
Article
The cryptocurrency market has carved out a notorious reputation for its extreme volatility, a characteristic that attracts both seasoned investors and newcomers eager to exploit rapid price fluctuations. Late 2024 was a particularly electrifying period for this market, especially during October and November, where one cryptocurrency experienced an extraordinary surge in its value. This spike captured the attention of traders and investors alike, driven by a confluence of factors such as increasing market adoption, favorable news surrounding the specific cryptocurrency project, and an overwhelming bullish sentiment that engulfed the digital asset landscape. However, the exhilarating ascent of this cryptocurrency was soon subdued by a critical warning sign: the emergence of a double top pattern, a well-known technical indicator that serves as a harbinger for a potential reversal in price trends. Understanding this double top formation is essential for anyone navigating the volatile waters of the cryptocurrency market. In essence, a double top manifests when an asset's price reaches two peaks at approximately the same level, failing to surpass a well-defined resistance zone. This situation arises when enthusiastic buyers push the price higher, only to face mounting selling pressure as traders seek to lock in profits, leading to an inability for the asset to maintain its lofty valuation. As the cryptocurrency experienced its bullish run, the vigilance among traders escalated sharply. Many began to track technical formations that foreshadowed possible declines, leading to a cautious atmosphere as the excitement of late 2024 receded. By mid-February 2025, the anticipated downturn took shape, with prices beginning their descent, ringing alarm bells among investors and analysts. These price movements spurred considerable discussions regarding the potential for market corrections, resulting in a reassessment of the entire cryptocurrency sector's health. During this period, significant resistance levels emerged at approximately 107,000 and 98,500, both of which acted as formidable barriers that the price struggled to breach. On the flip side, support levels were established at around 82,000 and 95,000, which served as psychological checkpoints for traders. These support zones typically indicate price areas perceived as undervalued, prompting increased buying activity that could help alleviate further downside pressure. A crucial metric for assessing the trading environment's vigor is trading volume, which encapsulates the level of enthusiasm among participants in the cryptocurrency sphere. On November 6, trading volumes soared to remarkable heights of 2,040 coins, fueled by a mixture of speculation and positive updates concerning market performance. This trend of heightened activity lingered into February 2025, as trading volumes peaked at an impressive 2,356 coins on February 3. While such spikes signal increased interest from traders, they can also amplify volatility, complicating the investment landscape. During this tumultuous period, pivotal technical indicators came to the forefront. Notably, the dreaded "death cross" occurred, marking a bearish indicator where the short-term moving average fell below its long-term counterpart. Compounding this indicator were negative divergences within both the DIF (the differential between short- and long-term moving averages) and DEA (the average of the short-term moving average), which collectively fostered widespread bearish sentiment among analysts. Many came to agree that further declines might occur, prompting a reevaluation of investment strategies. In light of these signals, numerous investors adopted risk-averse strategies to better navigate the unpredictable cryptocurrency landscape. Staying informed about market fluctuations became paramount, as knowledge frequently determined whether investors faced losses or were positioned to make well-informed, strategic decisions. Factors such as regulatory changes and technological advancements can swiftly alter market dynamics, further emphasizing the necessity of vigilance in this arena. In conclusion, while the cryptocurrency market offers remarkable growth opportunities, the trends observed in early 2025 suggest various pitfalls that investors must tread carefully around. This scenario vividly exemplifies the market’s volatile nature and reinforces the need for well-informed investment strategies amid uncertainty. Conducting a thorough retrospective analysis of this period unveils invaluable insights into the importance of meticulously evaluating macroeconomic factors alongside technical indicators. These lessons underscore that adaptability plays a pivotal role in optimizing investment decision-making outcomes, particularly in the fast-paced realm of cryptocurrency trading. The quest for profits should always be balanced with an acute awareness of the risks associated with this thrilling yet precarious environment.
Keywords
 Bitcoin
2025-03-09
Blockenza Analysis
The text outlines significant bearish indicators and a potential market downturn, suggesting that prices are more likely to fall as technical indicators and market sentiment have shifted negatively.
FAQs
1. What is the double top pattern?
A double top pattern is a technical indicator that signals a potential reversal in price trends, occurring when an asset's price peaks twice at the same level.
2. What causes volatility in the cryptocurrency market?
Volatility is primarily caused by rapid price fluctuations influenced by market sentiment, investor behavior, and external news.
3. What were the resistance levels noted in early 2025?
Resistance levels were significant around 107,000 and 98,500, where the price struggled to surpass.
4. What indicators suggested a bearish sentiment?
Indicators such as the 'death cross' and negative divergences in moving averages suggested a bearish sentiment.
5. How do support levels affect trading decisions?
Support levels are price points where traders perceive the asset as undervalued, potentially leading to increased buying activity.
6. Why is trading volume important?
Trading volume reflects the participation level in the market, indicating overall interest and can influence price volatility.
7. What strategies did investors adopt during this time?
Investors adopted risk-averse strategies to navigate the unpredictable market conditions.
8. How often should investors monitor market conditions?
It is crucial for investors to stay informed and monitor market conditions regularly to make informed decisions.
9. What might change market dynamics?
Factors such as regulatory changes and technological advancements can rapidly alter market dynamics.
10. What is the importance of a retrospective analysis?
A retrospective analysis provides insights into market trends, helping investors make better decisions based on past behaviors.
Related Articles
In this section, you will find articles and analyses related to this post. These materials will help you gain more information about the topic and develop a broader perspective on the digital currency market. By reading these articles, you can make more informed and precise decisions in your investment journey.

Revolutionary Move? Deutsche Bank Predicts Bitcoin Strategic Reserve Will Solidify US Crypto Leadership
Deutsche Bank has announced support for Bitcoin, advocating for a strategic reserve that could bolster the United States' leadership in the cryptocurrency sector. This endorsement could lead to broader acceptance of Bitcoin as a legitimate asset and influence other nations to follow suit.
Bitcoin
2025-03-11

Crypto Industry Demands Regulatory Clarity Over Bitcoin Reserve from Trump
Cryptocurrency executives believe that regulatory clarity in the US is more crucial for the industry than President Trump's initiative to create a national Bitcoin reserve. Trump's recent executive order has left the crypto community craving detailed guidance on regulations and taxation, as they faced significant losses amidst macroeconomic uncertainties.
Bitcoin
2025-03-11
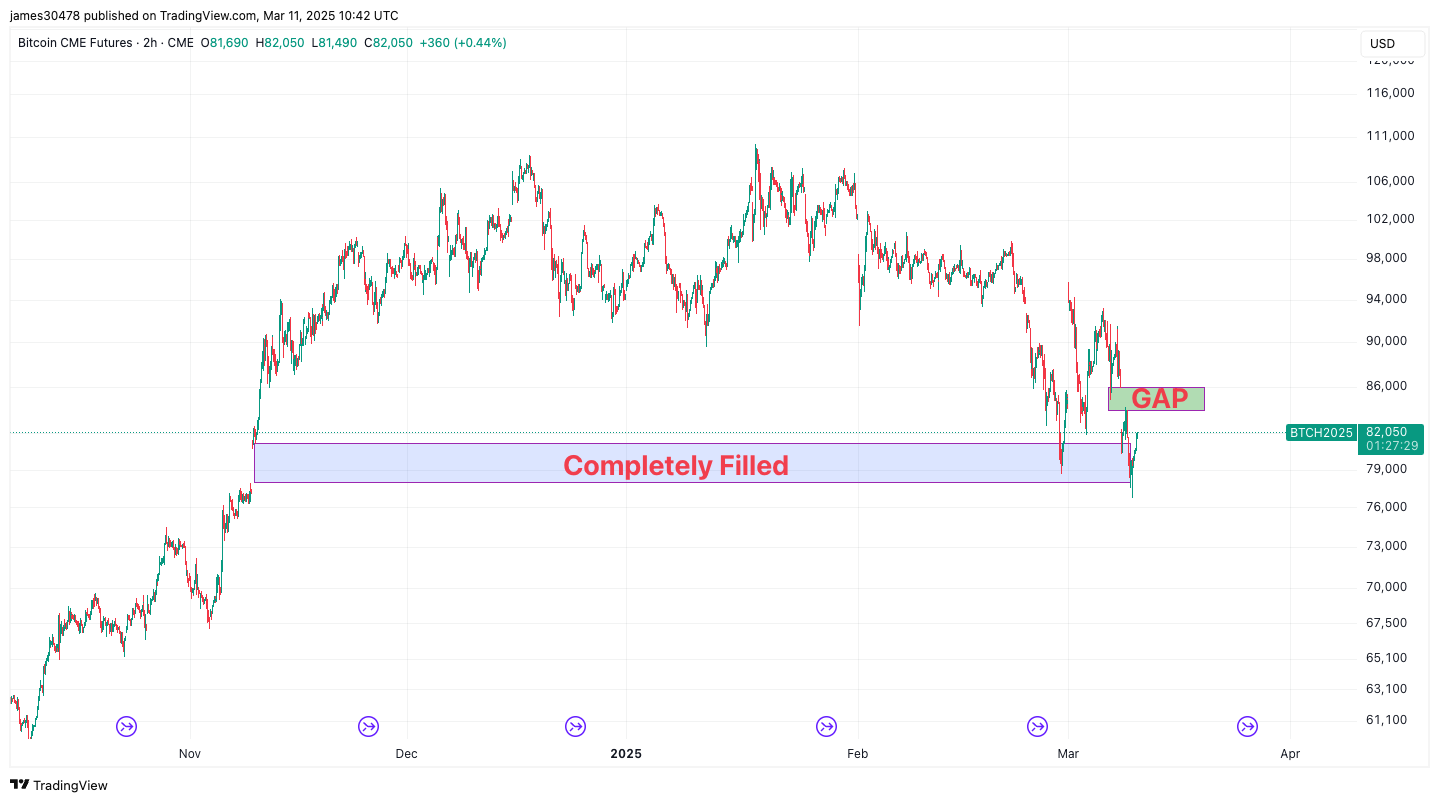
Bitcoin Fills Another CME Futures Gap as BTC Price Drops to $76,700
Bitcoin's price has dropped to $76,700, filling another gap in CME futures, indicating ongoing volatility in the market. Analysts continue to watch for potential short-term movements based on these fills.
Bitcoin
2025-03-11

'Rich Dad Poor Dad' Author Responds to Bitcoin Market Crash: 'I Will Keep Purchasing Bitcoin on Sale'
Robert Kiyosaki advocates for purchasing Bitcoin during its current low prices following a market decline. He views this as a valuable investment opportunity and plans to continue acquiring Bitcoin.
Bitcoin
2025-03-11
Bitcoin Price Falls Below $80,000, Analyst Predictions for the Future
Bitcoin's price has plummeted below $80,000 following days of market volatility, while several analysts offer insights into its future. Additionally, the majority of leading altcoins are also experiencing declines, worrying crypto investors.
Bitcoin
2025-03-11

Market Decline Affects Cryptocurrency Valuations
The cryptocurrency market is facing significant turbulence due to negative sentiments around technology stocks and recession fears, leading to substantial sell-offs, especially impacting Bitcoin and altcoins. Investors are monitoring the situation closely for any trends or cues.
Bitcoin
2025-03-11