
Fundamental Analysis of Cardano on March 10, 2025
The price movement of a specific cryptocurrency showcases significant bullish and bearish phases, providing essential insights for traders. Increased trading volumes, coupled with crucial support and resistance levels, highlight the volatility of the market and the importance of adopting cautious strategies moving forward.
Article
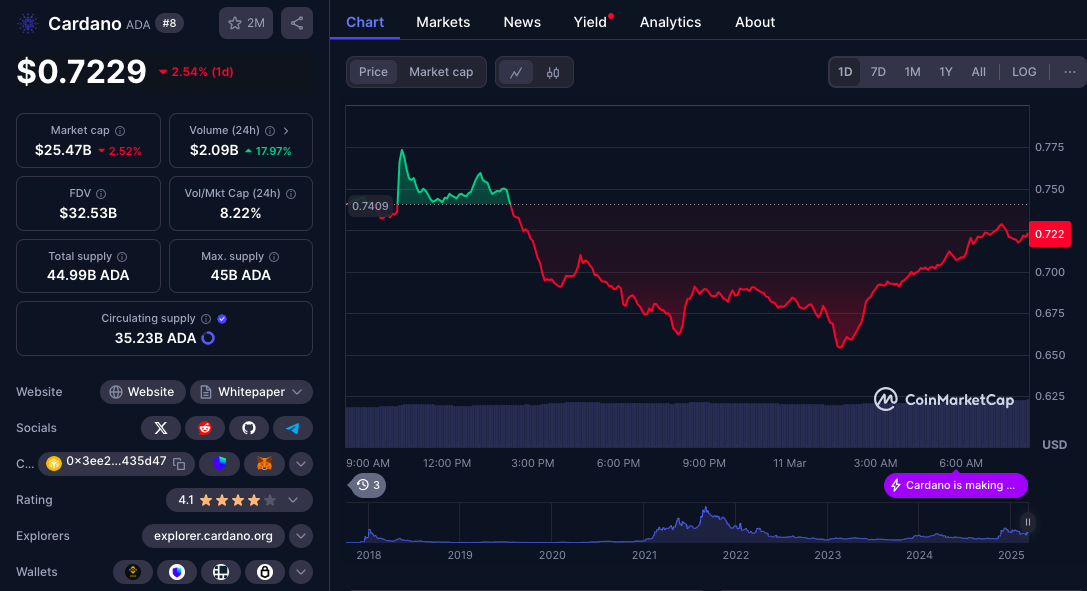
The price movement of digital assets serves as a compelling narrative filled with numerous bullish and bearish phases that offer valuable insights into future trading strategies and investor psychology. Such a complex interplay of market dynamics requires careful examination to fully comprehend the motivations behind price fluctuations. Beginning on October 10, 2024, a particular cryptocurrency embarked on a significant uptrend that lasted until November 23, 2024. This upward trajectory was fueled by an increasing sense of optimism among investors, a critical driver of the asset's rising prices. Throughout this period, broader economic conditions positively influenced market sentiment, leading to heightened demand and encouraging new investments in the cryptocurrency space. As investors flooded in, the asset's price surged, reflecting their confidence in its future potential. However, after this bullish rally, the market experienced a correction phase—a normal occurrence in the life cycle of any asset. Corrections often materialize for several reasons, including profit-taking by early investors, who capitalize on their gains, and a necessary adjustment process as the market seeks to realign valuations. This pullback serves essential functions, allowing traders to consolidate their profits while also providing an opportunity to reassess the asset's intrinsic value in the context of prevailing market conditions. From this point of optimism, the asset then experienced a transition into a downward trend starting on February 10, 2025. A bearish market can raise alarm bells among investors, inducing fear and prompting many to question whether these movements indicate a more profound downturn or are simply part of a regular market cycle. Indeed, on March 2, 2025, a notable surge in price suggested that buyers had begun to return, reigniting some optimism. However, the subsequent weakening of bullish momentum signaled a potential hesitation among investors, raising questions about the sustainability of the recovery. Understanding key levels of support and resistance became pivotal for traders navigating these fluctuations. For this cryptocurrency, notable support levels were identified at 0.63, 0.70, 0.85, and 0.90. These levels are crucial price points where buying interests typically emerge, creating a floor for prices and preventing further declines. On the flip side, resistance levels at around 0.83, 1.00, 1.15, and 1.24 serve as psychological barriers, inhibiting upward price movement as selling pressures mount. These statistics are vital for traders as they help establish entry and exit points in a fluctuating market environment. Accompanying the price action, trading volume data further illuminates market sentiment. Peaks in trading volume speak to the levels of investor engagement. In this case, significant volume spikes were recorded at 54.15 million units on November 10, 2024, and again at 50.24 million units on March 2, 2025. Such elevated trading volumes can suggest strong market conviction regarding price direction, hinting at emerging trends or possible reversals. Traders must keep a keen eye on these volumes to discern market trends accurately. Moreover, technical analysis tools like the Moving Average Convergence Divergence (MACD) provide insights into the asset's potential overbought conditions. Current values indicate that buyers may need to tread carefully as the asset approaches a correction threshold. Overall, while the asset appears to oscillate upward, traders should remain vigilant for potential pullbacks. Market dynamics are constantly evolving, and the capacity to adapt strategies to these changes is essential for success in today’s trading environment. The cryptocurrency market often resembles a roller coaster, experiencing dramatic peaks and valleys. Recently, a specific cryptocurrency has attracted significant attention due to its pronounced downward trend following an initial surge witnessed in early November 2024. Understanding current market conditions necessitates a careful analysis of key resistance and support levels, which are critical in determining potential future price trajectories. In conclusion, as the economic landscape surrounding cryptocurrencies continues to shift and evolve, a thorough understanding of essential technical metrics, market psychology, and trading patterns is vital for investors. Empowering oneself with knowledge and exercising caution within the inherently volatile cryptocurrency environment can help manage risks while also revealing potential opportunities. An informed approach to investment in this captivating but unpredictable domain is vital in navigating the challenges ahead.
Keywords
 Cardano
2025-03-10
Blockenza Analysis
The current analysis indicates a bearish sentiment in the cryptocurrency market, suggesting a high likelihood of further price declines.
FAQs
1. What is the recent trend of the cryptocurrency?
The cryptocurrency has shown pronounced downward trends after an initial surge.
2. What are key support levels for the cryptocurrency?
Key support levels are identified at 0.63 and 0.90.
3. What does the resistance level indicate?
The resistance level around 1.1500 signifies a hurdle that the price struggles to surpass.
4. What does high trading volume indicate?
High trading volume often suggests strong market conviction regarding the asset's price direction.
5. How does market volatility affect prices?
Market volatility can lead to sharp price declines or quick recoveries.
6. What is the MACD indicator used for?
The MACD helps evaluate potential overbought conditions in the asset.
7. How should investors react to price declines?
Investors should monitor support levels and consider their strategies in light of potential corrections.
8. Are there any signals for potential market reversal?
A bounce above support levels may signal a potential market recovery.
9. What strategies can investors use?
Being informed and using cautious investment strategies are essential.
10. What is the psychological impact of support and resistance levels?
Support and resistance levels act as psychological markers for traders during market entry and exit.
Related Articles
In this section, you will find articles and analyses related to this post. These materials will help you gain more information about the topic and develop a broader perspective on the digital currency market. By reading these articles, you can make more informed and precise decisions in your investment journey.

Cardano Faces Challenges at $0.80: Future Price Movement Depends on Bulls' Defense
Cardano (ADA) is at a critical support level of $0.80, and its future price movement depends on maintaining this range or risk falling deeper. Investors should remain vigilant as market dynamics will play a crucial role in shaping ADA's next steps.
Cardano
2025-03-11

The Magic Line: Key Support Level at $74,000 Determines Bitcoin's Bull or Bear Future
Bitcoin has recently faced a major correction, dropping 27.52% and currently hovering around the critical support level of $74,000, which is indicative of market sentiment and a historical buffer against bear markets. With fears of a recession and volatility impacting investor behavior, experts suggest a potential entry point for investors between $52,000 and $60,000 if BTC continues to decline.
Cardano
2025-03-11

Cardano: Is ADA Setting Up a Bear Trap Before a 2021-Style Breakout?
Cardano's ADA may be forming a classic bear trap that could lead to a breakout akin to its performance in 2021. Analysts are observing key price levels to determine the direction of ADA's future movements.
Cardano
2025-03-11
Cardano (ADA) Faces Key Resistance at $0.80—Will It Breakout or Drop Further?
Cardano (ADA) is trading within a critical support range of $0.66 and $0.80, and traders are monitoring its performance amid market volatility. In the last 24 hours, ADA has declined by 2.65%, raising concerns about further drops.
Cardano
2025-03-11

Ethereum (ETH) Strategic Reserve, Binance Coin (BNB) Hard Fork, and BitLemons Seizing the Moment
The cryptocurrency market presents various opportunities, highlighting BitLemons ($BLEM) as it approaches the end of its presale, while Ethereum upgrades and Binance Coin prepares for a hard fork. BitLemons boasts a functioning Web3 gaming platform and commitment to value creation, making it an appealing option for early investors.
Cardano
2025-03-11
What's Next for Cardano Price as Whales Accumulate 180 Million ADA
Cardano (ADA) has seen significant whale accumulation, with investors acquiring over 180 million ADA tokens, indicating renewed institutional interest. This trend points towards potential price stabilization and growth for Cardano in the long run.
Cardano
2025-03-11