
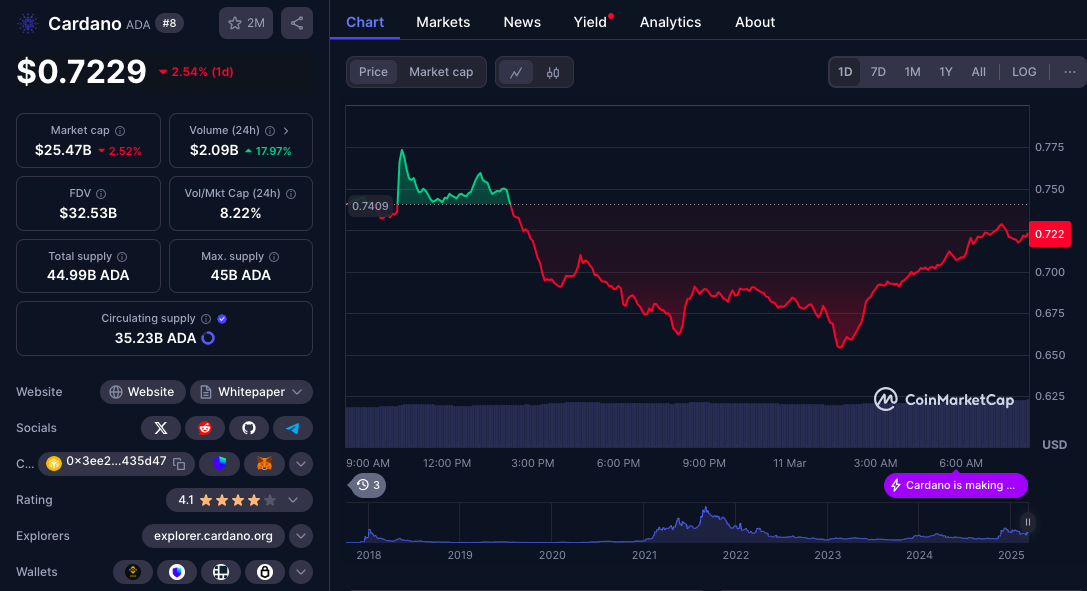
Fundamental Analysis of Cardano on March 3, 2025
The cryptocurrency market is currently experiencing a downturn following a price surge in November 2024, leading to cautious sentiment among traders. Despite bearish trends and technical indicators suggesting continued downward pressure, there are signs of possible recovery depending on future market dynamics.
Article
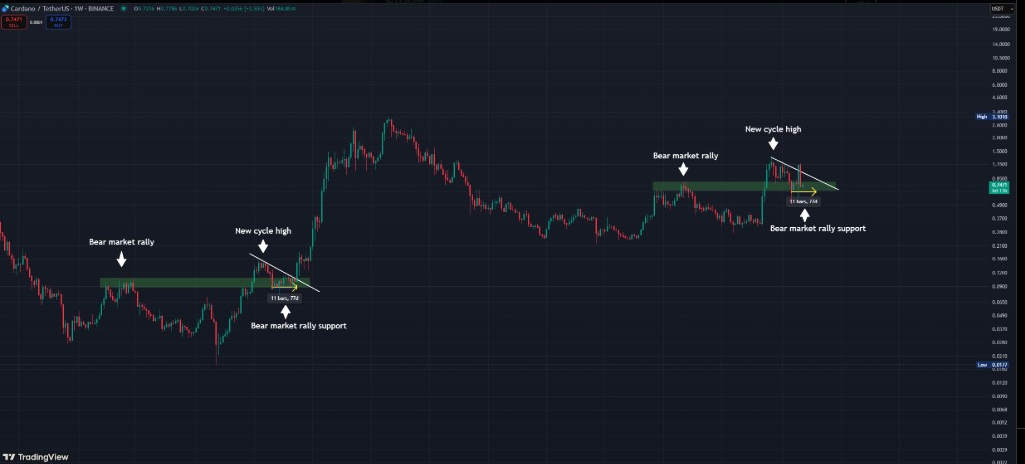
The cryptocurrency market has recently found itself in a state of turbulence, characterized by a pronounced downward trend that has left many traders and investors on edge. This shift followed a remarkable surge in value that took place in early November 2024 (UTC), where optimism thrived as digital currencies surged to impressive heights. However, this wave of enthusiasm quickly turned into a correction, creating a ripple effect throughout the market. By mid-December 2024 (UTC), a surprising decline took hold, which intensified apprehension among market participants, leading to a wave of cautious sentiment. As we transitioned into early February 2025 (UTC), the outlook appeared bleak, with a sharp drop in cryptocurrency prices triggering alarm bells and raising questions about the future direction of various digital assets. This decline has led to rampant speculation about what the market might hold next; however, it is crucial for investors to analyze price patterns critically, as these insights may yield valuable foresight into potential shifts in market momentum. One compelling signal emerged on February 11 (UTC), where a price pattern showcased a long shadow — an indicator suggesting that the bearish momentum might be losing potency. This provides a glimmer of hope for those keeping an eye out for signs of market recovery. Delving deeper into the technical analysis of the cryptocurrency landscape reveals vital resistance and support levels that are currently in play. The established resistance is situated around the range of 1.15 to 1.20, while the support level has been pegged at approximately 0.60 to 0.70. These thresholds are fundamental for traders, as they provide key benchmarks for potential price action moving forward. Currently, both short-term and long-term moving averages reflect a consistent downward trend, reinforcing the notion of continued bearish sentiment prevailing in the broader context of the market. Moreover, the Moving Average Convergence Divergence (MACD) indicator paints a telling portrait of bear dominance in the current marketplace. Nonetheless, an intriguing development is unfolding; while the downward momentum appears to be fading, the enduring bearish sentiment could persist in molding market behavior for the foreseeable future. It is crucial for traders to stay alert and closely observe the relationship between price movements and the resistance level mentioned earlier. A decisive breach above this resistance, supported by recovery in moving averages and MACD performance, could potentially set off a compelling rebound opportunity for cryptocurrencies. Conversely, should the market fail to regain positive momentum and break through its established resistance, the prospect of further downward pressure looms large. Therefore, it is prudent for traders to vigilantly monitor the Directional Indicator (DIF) and the Exponential Average (DEA) for any signs of a golden cross, which typically signals a potential trend reversal. Additionally, signs of bottom divergence in the MACD can provide crucial insights into whether the market is nearing a tipping point for recovery or if it remains entrenched in a bearish phase. In conclusion, while the cryptocurrency market is presently navigating a substantial downturn, both technical indicators and emerging patterns suggest the possibility of a potential recovery, contingent on the evolution of various factors in the forthcoming days and weeks. Traders and investors must adopt a cautious yet strategic approach, paying close attention to resistance and support levels, along with critical indicators like the MACD and moving averages. By making informed decisions during this period of volatility, market participants can position themselves advantageously in anticipation of changing dynamics in the cryptocurrency landscape.
Keywords
 Cardano
2025-03-03
Blockenza Analysis
The analysis indicates a bearish market sentiment currently dominating, with signs of potential recovery. However, until critical resistance levels are broken, the price is likely to continue facing downward pressure.
FAQs
1. What caused the recent downturn in the cryptocurrency market?
The downturn followed a significant price surge in November 2024, leading to a correction phase compounded by an unexpected decline in mid-December 2024.
2. What are the resistance and support levels currently in play?
The resistance level is around 1.15 to 1.20, while the support level sits at roughly 0.60 to 0.70.
3. What does the long shadow signal indicate?
The long shadow suggests that bearish momentum may be losing strength, indicating potential signs of recovery.
4. Which indicators should traders monitor for market trends?
Traders should watch the Moving Average Convergence Divergence (MACD), moving averages, and the Directional Indicator (DIF).
5. Is the market sentiment currently bullish or bearish?
Market sentiment remains bearish, as indicated by the consistent downward trends in both short-term and long-term moving averages.
6. What happens if the price breaks through the resistance level?
If the price breaks above the resistance level with supporting indicators, it could trigger a rebound opportunity.
7. What is meant by a 'golden cross'?
A 'golden cross' is a trading signal indicating a potential reversal in the trend, typically arising when a short-term moving average crosses above a long-term moving average.
8. How does the MACD contribute to analyzing market behavior?
The MACD helps to assess market momentum and can indicate possible trend reversals or continued bearish influences.
9. What should traders do in a volatile market?
Traders should remain strategic, focusing on resistance and support levels, and making informed decisions based on market indicators.
10. Are signs of recovery visible in the current market conditions?
Yes, there are indicators suggesting potential recovery, but traders should remain cautious as bearish sentiment persists.
Related Articles
In this section, you will find articles and analyses related to this post. These materials will help you gain more information about the topic and develop a broader perspective on the digital currency market. By reading these articles, you can make more informed and precise decisions in your investment journey.

Cardano Faces Challenges at $0.80: Future Price Movement Depends on Bulls' Defense
Cardano (ADA) is at a critical support level of $0.80, and its future price movement depends on maintaining this range or risk falling deeper. Investors should remain vigilant as market dynamics will play a crucial role in shaping ADA's next steps.
Cardano
2025-03-11

The Magic Line: Key Support Level at $74,000 Determines Bitcoin's Bull or Bear Future
Bitcoin has recently faced a major correction, dropping 27.52% and currently hovering around the critical support level of $74,000, which is indicative of market sentiment and a historical buffer against bear markets. With fears of a recession and volatility impacting investor behavior, experts suggest a potential entry point for investors between $52,000 and $60,000 if BTC continues to decline.
Cardano
2025-03-11

Cardano: Is ADA Setting Up a Bear Trap Before a 2021-Style Breakout?
Cardano's ADA may be forming a classic bear trap that could lead to a breakout akin to its performance in 2021. Analysts are observing key price levels to determine the direction of ADA's future movements.
Cardano
2025-03-11
Cardano (ADA) Faces Key Resistance at $0.80—Will It Breakout or Drop Further?
Cardano (ADA) is trading within a critical support range of $0.66 and $0.80, and traders are monitoring its performance amid market volatility. In the last 24 hours, ADA has declined by 2.65%, raising concerns about further drops.
Cardano
2025-03-11

Ethereum (ETH) Strategic Reserve, Binance Coin (BNB) Hard Fork, and BitLemons Seizing the Moment
The cryptocurrency market presents various opportunities, highlighting BitLemons ($BLEM) as it approaches the end of its presale, while Ethereum upgrades and Binance Coin prepares for a hard fork. BitLemons boasts a functioning Web3 gaming platform and commitment to value creation, making it an appealing option for early investors.
Cardano
2025-03-11
What's Next for Cardano Price as Whales Accumulate 180 Million ADA
Cardano (ADA) has seen significant whale accumulation, with investors acquiring over 180 million ADA tokens, indicating renewed institutional interest. This trend points towards potential price stabilization and growth for Cardano in the long run.
Cardano
2025-03-11