
Fundamental Analysis of Cryptocurrency as of March 3, 2025
In mid-November 2024, a cryptocurrency surged significantly but faced resistance indicated by a long upper shadow on the candlestick chart. As interest waned from December 2024 to February 2025, market indicators suggested a downward trend, leaving potential investors cautious about future price movements.
Article
In mid-November 2024, the cryptocurrency market experienced a notable surge that captured the attention of investors and analysts alike. This surge was not merely a product of speculative trading but was substantiated by a significant increase in trading volume, indicating heightened interest and active engagement among market participants. During this period, one particular cryptocurrency saw its value leap dramatically, demonstrating the kind of volatility and potential gains that characterize the crypto landscape. However, the rally witnessed on November 16 was tempered by the formation of a long upper shadow on the candlestick chart. This visual indicator serves as a critical warning sign of significant selling pressure. Although the price was briefly propelled to new heights by aggressive buyers, sellers quickly entered the market, pushing the price downward. This dynamic is crucial as it illustrates a robust resistance level that traders must consider. The presence of this upper shadow signals that even amid bullish sentiment, substantial selling exists, making it challenging for prices to maintain upward momentum. As we transitioned from December 2024 into early February 2025, the exuberant energy surrounding this cryptocurrency began to wane, unveiling a clear downward trend in the market. The initial days of January 2025 did, however, witness a revival of bullish sentiment, marked by a volume-driven rally. Yet, this excitement was short-lived; by the end of January, trading volumes had considerably decreased, suggesting a significant retreat within the buying community. This decline is a classic indicator of diminishing bullish momentum and serves as a warning sign for potential investors. During this transitional period, key technical indicators revealed an increasingly concerning outlook for the cryptocurrency in question. Notably, there was a well-established resistance level around 0.5500 and a support level at approximately 0.3000. These two points are pivotal for traders to watch, as they highlight critical junctures where price action may become volatile. The resistance level has historically demonstrated where selling pressure overcomes buying pressure, while the support level provides an area where buying interest typically materializes, potentially offering a bounce-back opportunity if tested. Further complicating the market's outlook was the occurrence of a 'death cross' in moving averages, a dire signal for many traders. A death cross arises when a shorter-term moving average crosses below a longer-term moving average, leading to a bearish mindset among investors. This phenomenon is often perceived as indicative of weak momentum and may foreshadow continued downward trends. Coupled with a weakening Moving Average Convergence Divergence (MACD) indicator—a trend-following momentum indicator that reflects the relationship between two moving averages—these signals cast a shadow over the cryptocurrency's prospects. In light of these technical indicators and prevailing market sentiment, potential investors should approach their trading strategies with extreme caution. Staying informed about market developments is essential, as the cryptocurrency arena is often subject to abrupt fluctuations driven by diverse factors, including regulatory changes, technological advancements, and shifts in overall investor sentiment. As speculative trading practices grow in prevalence, it is critically important for prospective investors to make decisions grounded in solid analysis and an acute understanding of market dynamics. Implementing risk management strategies, such as establishing stop-loss orders and diversifying investments across different assets, can be prudent steps to mitigate potential losses during volatile periods. While the allure of 'buying the dip' is tempting in times of market weakness, investors should recognize the associated risks. Timing the market is notoriously elusive, and thus, exercising calculated caution will serve investors better as they navigate the ongoing fluctuations of the cryptocurrency market. With increased vigilance and informed decision-making, investors can better position themselves to weather the uncertainties that lie ahead in this ever-evolving digital currency landscape.
Keywords
 Stellar
2025-03-03
Blockenza Analysis
The analysis suggests a bearish outlook for the cryptocurrency due to weakening momentum and diminishing buyer interest, which indicates further potential price declines.
FAQs
1. What happened to the cryptocurrency in mid-November 2024?
It experienced a significant surge in value accompanied by increased trading volume.
2. What does the long upper shadow on the candlestick chart indicate?
It signals significant selling pressure, showing that buyers pushed the price up briefly before sellers drove it down.
3. What resistance and support levels are identified for this cryptocurrency?
Resistance is around 0.5500 and support is approximately at 0.3000.
4. What is a death cross in moving averages?
A death cross occurs when a shorter-term moving average crosses below a longer-term moving average, indicating potential downward price movement.
5. What does a declining trading volume toward the end of January suggest?
It indicates diminishing interest from buyers and a retreat in bullish sentiment.
6. Why is it important for investors to exercise caution?
The cryptocurrency market is highly volatile and influenced by various factors, making informed decision-making crucial.
7. What strategies can investors use to manage risks?
Investors can set stop-loss orders and diversify their investments.
8. What does the MACD indicator signify?
The MACD highlights the relationship between two moving averages and indicates overall momentum in the market.
9. When should the 'buy the dip' strategy be approached with caution?
In times of apparent market weakness, as timing the market can be challenging and risky.
10. What is the overarching sentiment in the cryptocurrency market as of February 2025?
The sentiment appears to be bearish as indicated by various market technical indicators.
Related Articles
In this section, you will find articles and analyses related to this post. These materials will help you gain more information about the topic and develop a broader perspective on the digital currency market. By reading these articles, you can make more informed and precise decisions in your investment journey.
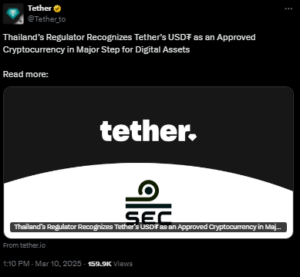
Thailand Approves USDT and USDC for Cryptocurrency Trading
Thailand's SEC has approved Tether's USDt and Circle's USDC for trading on regulated exchanges, aiming to embrace digital assets while ensuring regulatory compliance. This approval could potentially enhance the crypto trading landscape within the country.
Stellar
2025-03-11
Fundamental Analysis of Cryptocurrency on 11-03-2025
The cryptocurrency market saw a significant surge in mid-November 2024, followed by a notable downtrend as bearish sentiment prevailed through early 2025. Key resistance and support levels were identified, and technical indicators pointed towards a continued bearish outlook amidst diminishing trading volumes.
Stellar
2025-03-11
Tired Of Crypto Losses? Follow Smart Dogecoin Wallets Who Have Piled Millions Into This 10000x Altcoin
The meme coin sector is currently declining due to issues surrounding Trump's Bitcoin reserve strategy, impacting Dogecoin. Meanwhile, a new DeFi project, Remittix, is gaining traction among traders for its unique use case and promising ROI.
Stellar
2025-03-11

Technical Analysis of Cryptocurrency as of March 11, 2025
The cryptocurrency showed an upward trend in late November 2024 but could not maintain its momentum, facing significant selling pressure. After further declines and a critical breach of support levels, market indicators suggest a continued bearish outlook.
Stellar
2025-03-11
This Token is Predicted to Explode and Reach $1 Faster Than Stellar (XLM), Dogecoin (DOGE), and Polygon (POL)
BinoFi (BINO) is a new cryptocurrency that is gaining attention for its advanced technology and market momentum, with potential to hit the $1 milestone faster than established tokens like Stellar, Dogecoin, and Polygon. Its innovative features and growing investor interest suggest it could become a significant player in the digital asset space.
Stellar
2025-03-11

Thailand SEC Approves Tether (USDT) and Circle (USDC) as Trading Pairs
Thailand's SEC has approved Tether (USDT) and Circle (USDC) as trading pairs on regulated digital asset exchanges, following strong public support. This decision marks a significant evolution in the country's cryptocurrency landscape.
Stellar
2025-03-11
Thailand Approves USDT and USDC for Cryptocurrency Trading
Thailand's SEC has approved Tether's USDt and Circle's USDC for trading on regulated exchanges, aiming to embrace digital assets while ensuring regulatory compliance. This approval could potentially enhance the crypto trading landscape within the country.
Stellar
2025-03-11
Fundamental Analysis of Cryptocurrency on 11-03-2025
The cryptocurrency market saw a significant surge in mid-November 2024, followed by a notable downtrend as bearish sentiment prevailed through early 2025. Key resistance and support levels were identified, and technical indicators pointed towards a continued bearish outlook amidst diminishing trading volumes.
Stellar
2025-03-11
Tired Of Crypto Losses? Follow Smart Dogecoin Wallets Who Have Piled Millions Into This 10000x Altcoin
The meme coin sector is currently declining due to issues surrounding Trump's Bitcoin reserve strategy, impacting Dogecoin. Meanwhile, a new DeFi project, Remittix, is gaining traction among traders for its unique use case and promising ROI.
Stellar
2025-03-11
Technical Analysis of Cryptocurrency as of March 11, 2025
The cryptocurrency showed an upward trend in late November 2024 but could not maintain its momentum, facing significant selling pressure. After further declines and a critical breach of support levels, market indicators suggest a continued bearish outlook.
Stellar
2025-03-11
This Token is Predicted to Explode and Reach $1 Faster Than Stellar (XLM), Dogecoin (DOGE), and Polygon (POL)
BinoFi (BINO) is a new cryptocurrency that is gaining attention for its advanced technology and market momentum, with potential to hit the $1 milestone faster than established tokens like Stellar, Dogecoin, and Polygon. Its innovative features and growing investor interest suggest it could become a significant player in the digital asset space.
Stellar
2025-03-11
Thailand SEC Approves Tether (USDT) and Circle (USDC) as Trading Pairs
Thailand's SEC has approved Tether (USDT) and Circle (USDC) as trading pairs on regulated digital asset exchanges, following strong public support. This decision marks a significant evolution in the country's cryptocurrency landscape.
Stellar
2025-03-11