
Fundamental Analysis of Cryptocurrency as of March 8, 2025
The cryptocurrency market is characterized by volatility, with recent trends displaying a sharp rise followed by a substantial decline. Critical resistance and support levels have been identified, along with technical indicators suggesting cautious movements, prompting investors to adopt vigilant strategies amidst this unpredictable landscape.
Article
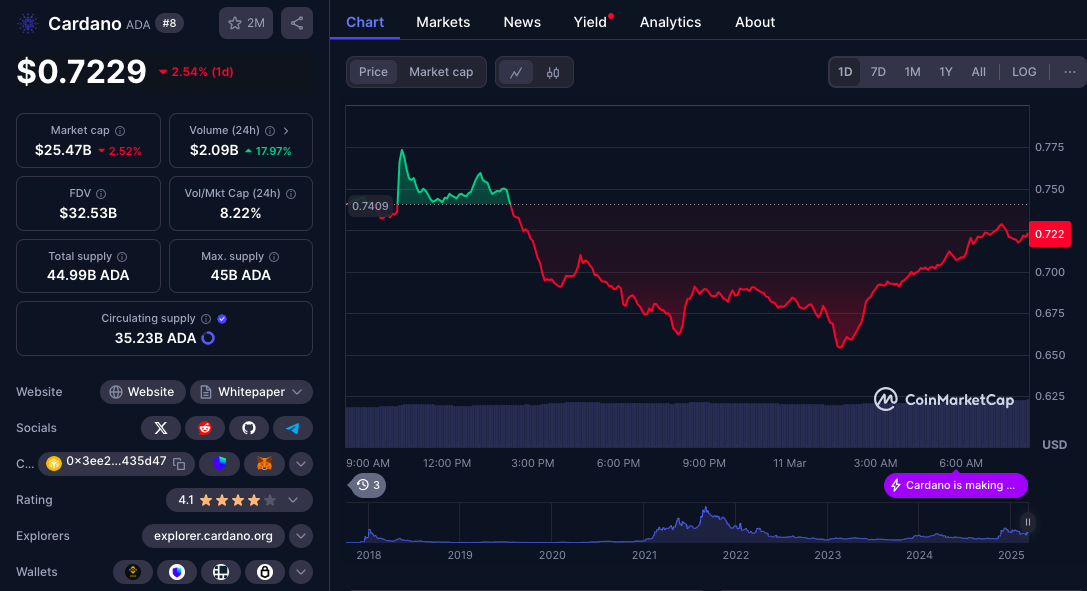
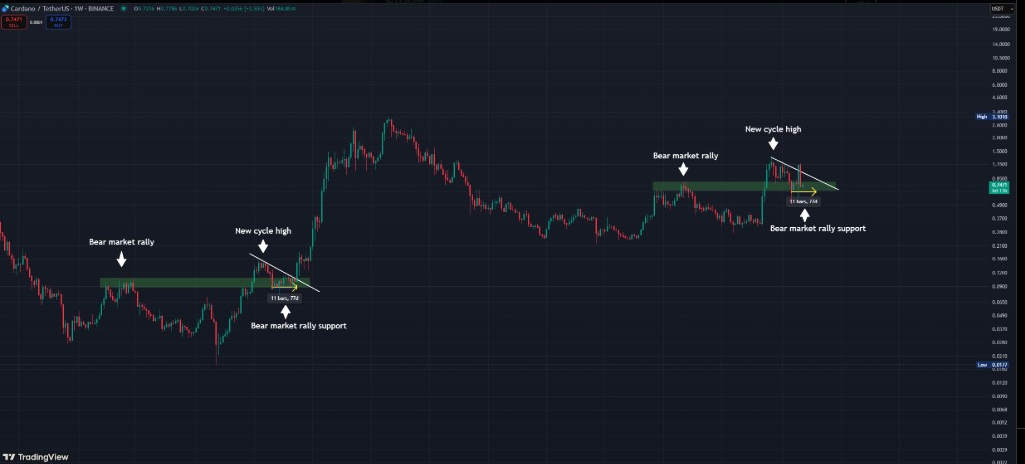
The world of cryptocurrency is notorious for its rapid price fluctuations, resembling the capricious nature of broader financial markets. As cryptocurrency assets have surged in popularity and mainstream acceptance, investors must remain alert to their recent price movements, as analyzing these changes provides critical insights into future performance and investment strategies. Between October and mid-November 2024, a particular cryptocurrency showcased an impressive volatile upward trend. During this span, bullish sentiment surged among investors, driving prices to unprecedented heights. The excitement surrounding innovations in blockchain technology and the growing acceptance of digital currencies across various industries invigorated investor confidence. Factors such as increased institutional investments and positive regulatory developments contributed to a remarkable rally that made headlines. However, for anyone with experience in the cryptocurrency market, the exhilarating ascend was accompanied by the inherent volatility characteristic of digital assets, suggesting that such rapid increases could soon be followed by corrections or downtrends. On November 22, 2024, the upward trajectory encountered a pivotal moment illustrated by a long upper wick on the daily price chart. This candlestick pattern typically indicates that prices rose to a certain level but could not maintain that momentum, as bearish market pressures set in. This wick signifies a shift in investor sentiment; while the enthusiasm to push prices higher was initially strong, selling pressure quickly emerged. The inevitable correction unfolded dramatically between late January and early February 2025, as the cryptocurrency experienced a steep downturn reminiscent of a cliff plunge—an unsettling reminder of the market's unpredictable nature. For unprepared investors, this sharp decline likely generated anxiety and uncertainty. As the dust settled from this decline, the cryptocurrency demonstrated signs of stabilization and recovery in early March. A significant bullish candle emerged on March 2, 2025, marking a turning point as prices surged upward, signaling renewed investor confidence. Trading volumes peaked at an impressive 50.24 million units on that day, reflecting a strong interest in the asset. Nevertheless, it is important to note that despite the remarkable price surge, bullish momentum exhibited signs of fatigue soon after, hinting that there might be difficulties ahead. Scrutinizing the price movements further, two essential levels emerge for traders and investors: a resistance level around 1.1500 established by the high on March 2, 2025, and a support level at approximately 0.8000. These levels are critical for traders, indicating where price movements will likely oscillate in the near term. Vigilance to these support and resistance levels will equip investors with insight into potential breakouts or breakdowns to be expected in the near future. In addition to these price levels, technical indicators also play a vital role in analysis. The Moving Average Convergence Divergence (MACD) indicator, which assists in determining momentum trends, recently exhibited a crossover with a Differential (DIF) value of 0.026 and a Signal (DEA) value of -0.0058, raising concerns among traders about the sustainability of the bullish run. The histogram value, sitting at 0.0319, demonstrates the presence of some bullish momentum; however, the apparent vagaries suggest that traders should remain cautious. A potential pullback could be on the horizon, which warrants careful monitoring. In conclusion, as the cryptocurrency landscape continues to evolve, those engaging in cryptocurrency trading must stay alert to market dynamics—even more so in light of recent price actions. With the potential for corrective pressures looming, a keen awareness of vital support and resistance levels, alongside valuable technical indicators like MACD, becomes essential for making informed investment decisions. Navigating the cryptocurrency market is an exhilarating endeavor, but it carries significant risks; developing sound strategies and conducting ongoing analysis is pivotal to thriving in this captivating yet tumultuous environment.
Keywords
 Cardano
2025-03-08
Blockenza Analysis
The analysis suggests a cautious outlook for the cryptocurrency, with potential for price drop due to prevailing volatility and weakness in bullish momentum.
FAQs
1. What characterized the cryptocurrency's price movements from October to November 2024?
The cryptocurrency experienced a volatile upward trend driven by bullish sentiment and increasing adoption.
2. What does a long upper wick on a price chart signify?
It indicates that prices reached a high that couldn't be sustained due to selling pressure.
3. When did the cryptocurrency face a significant decline?
The cryptocurrency faced a dramatic decline between late January and early February 2025.
4. What key levels should investors monitor?
Investors should monitor the resistance level around 1.1500 and the support level at approximately 0.8000.
5. What does the Moving Average Convergence Divergence (MACD) indicate?
MACD crossing over signals caution among traders, suggesting potential bullish momentum but also weaknesses.
6. What trading volume was observed on March 2, 2025?
The trading volume reached 50.24 million units on March 2, 2025.
7. What is the expected future for this cryptocurrency based on recent trends?
While there are signs of recovery, potential corrective pressures and weakening bullish momentum should be monitored.
8. How can technical indicators assist investors?
Technical indicators help provide insights into potential price movements and assist in making informed trading decisions.
9. Why is monitoring support and resistance levels critical?
They indicate important boundaries for price movements and potential breakouts or breakdowns.
10. What overall strategy should cryptocurrency traders adopt?
Traders should remain vigilant and employ sound strategies based on market analysis.
Related Articles
In this section, you will find articles and analyses related to this post. These materials will help you gain more information about the topic and develop a broader perspective on the digital currency market. By reading these articles, you can make more informed and precise decisions in your investment journey.

Cardano Faces Challenges at $0.80: Future Price Movement Depends on Bulls' Defense
Cardano (ADA) is at a critical support level of $0.80, and its future price movement depends on maintaining this range or risk falling deeper. Investors should remain vigilant as market dynamics will play a crucial role in shaping ADA's next steps.
Cardano
2025-03-11

The Magic Line: Key Support Level at $74,000 Determines Bitcoin's Bull or Bear Future
Bitcoin has recently faced a major correction, dropping 27.52% and currently hovering around the critical support level of $74,000, which is indicative of market sentiment and a historical buffer against bear markets. With fears of a recession and volatility impacting investor behavior, experts suggest a potential entry point for investors between $52,000 and $60,000 if BTC continues to decline.
Cardano
2025-03-11

Cardano: Is ADA Setting Up a Bear Trap Before a 2021-Style Breakout?
Cardano's ADA may be forming a classic bear trap that could lead to a breakout akin to its performance in 2021. Analysts are observing key price levels to determine the direction of ADA's future movements.
Cardano
2025-03-11
Cardano (ADA) Faces Key Resistance at $0.80—Will It Breakout or Drop Further?
Cardano (ADA) is trading within a critical support range of $0.66 and $0.80, and traders are monitoring its performance amid market volatility. In the last 24 hours, ADA has declined by 2.65%, raising concerns about further drops.
Cardano
2025-03-11

Ethereum (ETH) Strategic Reserve, Binance Coin (BNB) Hard Fork, and BitLemons Seizing the Moment
The cryptocurrency market presents various opportunities, highlighting BitLemons ($BLEM) as it approaches the end of its presale, while Ethereum upgrades and Binance Coin prepares for a hard fork. BitLemons boasts a functioning Web3 gaming platform and commitment to value creation, making it an appealing option for early investors.
Cardano
2025-03-11
What's Next for Cardano Price as Whales Accumulate 180 Million ADA
Cardano (ADA) has seen significant whale accumulation, with investors acquiring over 180 million ADA tokens, indicating renewed institutional interest. This trend points towards potential price stabilization and growth for Cardano in the long run.
Cardano
2025-03-11