
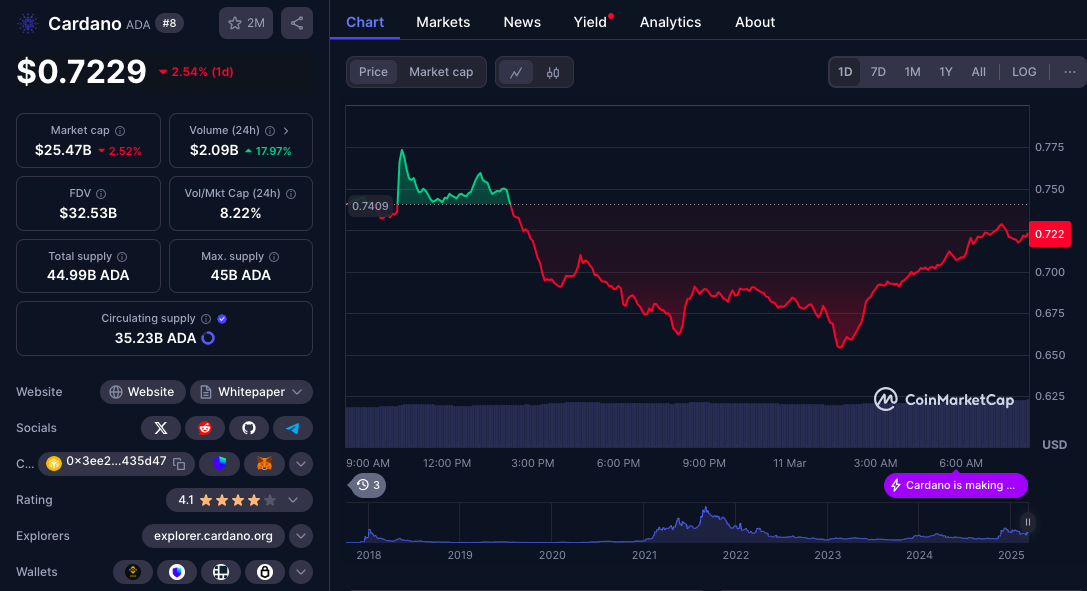
Fundamental Analysis of Cryptocurrency on March 6, 2025
The cryptocurrency market is highly volatile, showcasing an upward trend in November 2024 followed by a correction in December and subsequent bearish sentiments early in 2025. Traders are closely watching resistance and support levels, along with technical indicators, to navigate this evolving landscape and assess potential buying opportunities.
Article
In the fast-paced realm of cryptocurrency, the trajectories of various coins often resemble a wild rollercoaster ride. These digital assets possess the potential for astronomical gains, yet they can equally descend into deep valleys, leaving investors on the edge of their seats. One notable cryptocurrency recently grabbed attention for its impressive performance in November 2024, sparking excitement and optimism among investors and traders. However, the euphoria was short-lived, transforming into a spate of challenges that plagued the market in the latter part of the year. As we venture into early February 2025, it is clear that the market sentiment has undergone a significant shift towards pessimism. A turning point for this cryptocurrency came on November 22 when a long upper wick was formed, signaling a fierce attempt to rally prices higher. Nevertheless, the selling pressure pushed the price down, causing it to close significantly beneath the day’s high, leading many to question the sustainability of the upward trend. This was further exacerbated on December 9 when the market experienced what can only be described as a catastrophic drop, resembling a cliff-like plunge. Such steep declines are understandably alarming for investors, yet they are not unusual in the cyclical nature of cryptocurrency markets. Recognizing that price action like this can trigger panic sales is essential for anyone involved in trading these assets. As the calendar flipped to February, the currency exhibited a new dynamic with the formation of a long lower wick on February 3. This behavior typically indicates a potential buying opportunity at lower price levels. However, it offered little assurance of a bullish trend reversal and instead amplified the prevailing uncertainty in the market. The oscillation of price patterns during this period highlights the elevated volatility that traders must contend with and emphasizes the challenges faced by investors trying to make sense of this chaotic environment. An understanding of resistance and support levels is paramount in illuminating the cryptocurrency's price action. Throughout these turbulent months, the coin faced scrutiny at key resistance points—most notably at 1.1632 (UTC), 1.3262 (UTC), and 1.1733 (UTC)—failing to break through these barriers effectively. This inability has generated an atmosphere of skepticism among traders. On the contrary, significant support levels were shattered, particularly at 0.8302 (UTC) and 0.5177 (UTC), showcasing the overwhelming selling pressure that has dominated the landscape. At present, the cryptocurrency clings to a price around 0.9375, marking a precarious point of indecision within an unpredictable market. Investors are closely monitoring the possibility of pushing above the 0.9550 threshold, as it could signal a path for recovery and a potential turnaround. Conversely, a downturn dipping below 0.7579 could facilitate further bearish sentiment, with insights suggesting that the downward trend may not yet be exhausted. Intriguingly, recent technical analysis has revealed that short-term moving averages are beginning to cross above their longer-term counterparts, a classic sign of potential bullish momentum. However, the instability of these averages hints at a prevailing sense of uncertainty disallowing complacency among investors. The Moving Average Convergence Divergence (MACD) indicator further echoes this mixed sentiment, suggesting potential glimpses of a rebound may exist, yet warns that such strength is limited and may not foster a sustainable uptrend. To conclude, as this cryptocurrency navigates turbulent waters, it is imperative for investors to maintain a cautious approach. Staying attuned to fluctuations around key resistance and support levels could significantly impact the asset’s short-term fate. The intersection of historical price patterns and technical indicators reveals a mixed bag of signals, unveiling the mesmerizing yet unpredictable landscape of cryptocurrency trading. For those equipped with astute analysis and effective strategies, the potential for opportunities still lingers, even amidst the prevailing volatility. It’s a world where both art and science converge, and navigating it wisely can lead to lucrative rewards.
Keywords
 Cardano
2025-03-06
Blockenza Analysis
The analysis indicates a slight positive outlook due to recent bullish signals, but uncertainty and volatility persist, suggesting cautious optimism.
FAQs
1. What was the trend of the cryptocurrency in November 2024?
The cryptocurrency saw a significant upward trend, generating optimism among investors and traders.
2. What happened to the cryptocurrency in December 2024?
The cryptocurrency entered a correction phase and experienced bearish sentiment, leading to a downturn.
3. What significant pattern occurred on November 22, 2024?
A long upper wick formed, indicating attempts to push the price higher, but selling pressure closed the price below the day’s high.
4. What is the importance of support and resistance levels?
Support and resistance levels help traders understand price action and make informed decisions.
5. What indicators suggest potential bullish sentiment?
The crossing of short-term moving averages above longer-term moving averages indicates potential bullish sentiment.
6. What does the long lower wick indicate on February 3, 2025?
It suggests a buying opportunity at lower levels but does not guarantee a bullish reversal.
7. What price points should traders watch for potential trends?
Key resistance at 0.9550 and support around 0.7579 are critical for assessing price movements.
8. How do MACD indicators influence trading decisions?
When the MACD line crosses above its signal line, it serves as a potential bullish reversal signal.
9. What should investors do amid the current price volatility?
Investors should proceed with caution and monitor fluctuations around key resistance and support levels.
10. What is the overall sentiment of the cryptocurrency market as of now?
The market sentiment remains mixed with signs of uncertainty and volatility, requiring careful analysis.
Related Articles
In this section, you will find articles and analyses related to this post. These materials will help you gain more information about the topic and develop a broader perspective on the digital currency market. By reading these articles, you can make more informed and precise decisions in your investment journey.

Cardano Faces Challenges at $0.80: Future Price Movement Depends on Bulls' Defense
Cardano (ADA) is at a critical support level of $0.80, and its future price movement depends on maintaining this range or risk falling deeper. Investors should remain vigilant as market dynamics will play a crucial role in shaping ADA's next steps.
Cardano
2025-03-11

The Magic Line: Key Support Level at $74,000 Determines Bitcoin's Bull or Bear Future
Bitcoin has recently faced a major correction, dropping 27.52% and currently hovering around the critical support level of $74,000, which is indicative of market sentiment and a historical buffer against bear markets. With fears of a recession and volatility impacting investor behavior, experts suggest a potential entry point for investors between $52,000 and $60,000 if BTC continues to decline.
Cardano
2025-03-11

Cardano: Is ADA Setting Up a Bear Trap Before a 2021-Style Breakout?
Cardano's ADA may be forming a classic bear trap that could lead to a breakout akin to its performance in 2021. Analysts are observing key price levels to determine the direction of ADA's future movements.
Cardano
2025-03-11
Cardano (ADA) Faces Key Resistance at $0.80—Will It Breakout or Drop Further?
Cardano (ADA) is trading within a critical support range of $0.66 and $0.80, and traders are monitoring its performance amid market volatility. In the last 24 hours, ADA has declined by 2.65%, raising concerns about further drops.
Cardano
2025-03-11

Ethereum (ETH) Strategic Reserve, Binance Coin (BNB) Hard Fork, and BitLemons Seizing the Moment
The cryptocurrency market presents various opportunities, highlighting BitLemons ($BLEM) as it approaches the end of its presale, while Ethereum upgrades and Binance Coin prepares for a hard fork. BitLemons boasts a functioning Web3 gaming platform and commitment to value creation, making it an appealing option for early investors.
Cardano
2025-03-11
What's Next for Cardano Price as Whales Accumulate 180 Million ADA
Cardano (ADA) has seen significant whale accumulation, with investors acquiring over 180 million ADA tokens, indicating renewed institutional interest. This trend points towards potential price stabilization and growth for Cardano in the long run.
Cardano
2025-03-11