
Technical Analysis of Bitcoin as of March 6, 2025
The market experienced an upward trend from early October to mid-November 2024, but could not maintain its momentum after a breakout in mid-December. A downward trend began in February 2025, and due to high market risk, it is advisable to operate cautiously.
Article
The financial market experienced a significant upward movement from early October to mid-November 2024 (UTC), marking a period of optimism among traders and investors alike. This upward trend can be attributed to a combination of favorable economic indicators, positive corporate earnings reports, and an overall increase in market confidence. However, by mid-November, the landscape began to shift, as the market entered a phase of fluctuations at elevated levels. During this time, market analysts observed a potential double top formation, a technical analysis pattern that often signals a reversal in price trends. The double top formation typically occurs when prices reach a peak level twice, failing to break through the resistance point, which raises concerns among traders about a possible decline. This pattern underscores the importance of monitoring resistance levels, which, in this case, are identified at 107,700 (UTC) and 99,500 (UTC). Despite a breakout occurring in mid-December, the promised upward momentum soon dissipated, leading to heightened uncertainty in the market. As the year transitioned into February 2025, a downward trend emerged (UTC), characterized by heightened trading volume and suggesting that the downward trajectory may persist. The increase in trading volume during a decline is particularly telling, often signifying that more traders are entering the market, responding to key indicators or shifts in investor sentiment. For those engaged actively in trading, understanding the implications of such increases in volume is crucial. It typically indicates strong conviction in the new price levels, which may lead to continued depreciation if the trend persists. Moreover, it's essential to recognize the key support levels in this market phase, which stand at 91,000 (UTC) and 82,300 (UTC). These support levels act as psychological barriers for traders; if breached, they could lead to further selling pressure and exacerbate the downward trend. The market's technical indicators, including the short-term moving average being considerably lower than the long-term moving average, point towards bearish sentiment. This divergence not only reflects the market's current state but also underscores the need for traders to adapt their strategies accordingly. The market indicators paint a rather grim picture. With the DIF value at -2668 and the DEA value at -2601, coupled with a negative MACD histogram, traders are on high alert. Such negative readings often indicate that the momentum is against any bullish moves, reinforcing a sentiment of caution. The MACD (Moving Average Convergence Divergence) is a beloved tool among traders, widely used for identifying potential buy or sell signals through the relationship between short-term and long-term price movements. The current negative MACD signals could lead to further downside risk, painting a picture that is decidedly inhospitable for optimistic trading positions. Given the current risks highlighted by these technical indicators, a cautious approach to trading is advisable. As the market continues to fluctuate, it is imperative for traders and investors to remain vigilant, constantly reassessing their strategies based on real-time market data and trends. This proactive measure will be critical in navigating the tumultuous conditions that characterize the market’s current trajectory. Ultimately, informed decision-making supported by robust market analysis will be paramount in safeguarding against losses and capitalizing on potential opportunities as they arise in the future.
Keywords
 Bitcoin
2025-03-06
Blockenza Analysis
Given the downward trend and high market risk indicated by negative values in both the DIF and MACD, it is likely the price will continue to fall.
FAQs
1. What trend did the market show from October to November 2024?
The market showed an upward trend from early October to mid-November 2024.
2. What happened in mid-December 2024?
The market broke through a resistance level but could not maintain its upward momentum.
3. When did the downward trend begin?
The downward trend began in February 2025.
4. What are the key resistance levels mentioned?
The key resistance levels are 107,700 and 99,500.
5. What are the key support levels mentioned?
The key support levels are 91,000 and 82,300.
6. What does the DIF value indicate?
The DIF value is -2668, indicating bearish market conditions.
7. What is the recommended approach to trading?
It is recommended to operate cautiously due to high overall market risk.
8. What was observed in trading volume during the downward trend?
Trading volume increased during the downward trend.
9. What does the short-term moving average indicate?
The short-term moving average is significantly lower than the long-term moving average, indicating a bearish trend.
10. What is the MACD histogram indicative of?
The negative MACD histogram indicates high market risk.
Related Articles
In this section, you will find articles and analyses related to this post. These materials will help you gain more information about the topic and develop a broader perspective on the digital currency market. By reading these articles, you can make more informed and precise decisions in your investment journey.

Revolutionary Move? Deutsche Bank Predicts Bitcoin Strategic Reserve Will Solidify US Crypto Leadership
Deutsche Bank has announced support for Bitcoin, advocating for a strategic reserve that could bolster the United States' leadership in the cryptocurrency sector. This endorsement could lead to broader acceptance of Bitcoin as a legitimate asset and influence other nations to follow suit.
Bitcoin
2025-03-11

Crypto Industry Demands Regulatory Clarity Over Bitcoin Reserve from Trump
Cryptocurrency executives believe that regulatory clarity in the US is more crucial for the industry than President Trump's initiative to create a national Bitcoin reserve. Trump's recent executive order has left the crypto community craving detailed guidance on regulations and taxation, as they faced significant losses amidst macroeconomic uncertainties.
Bitcoin
2025-03-11
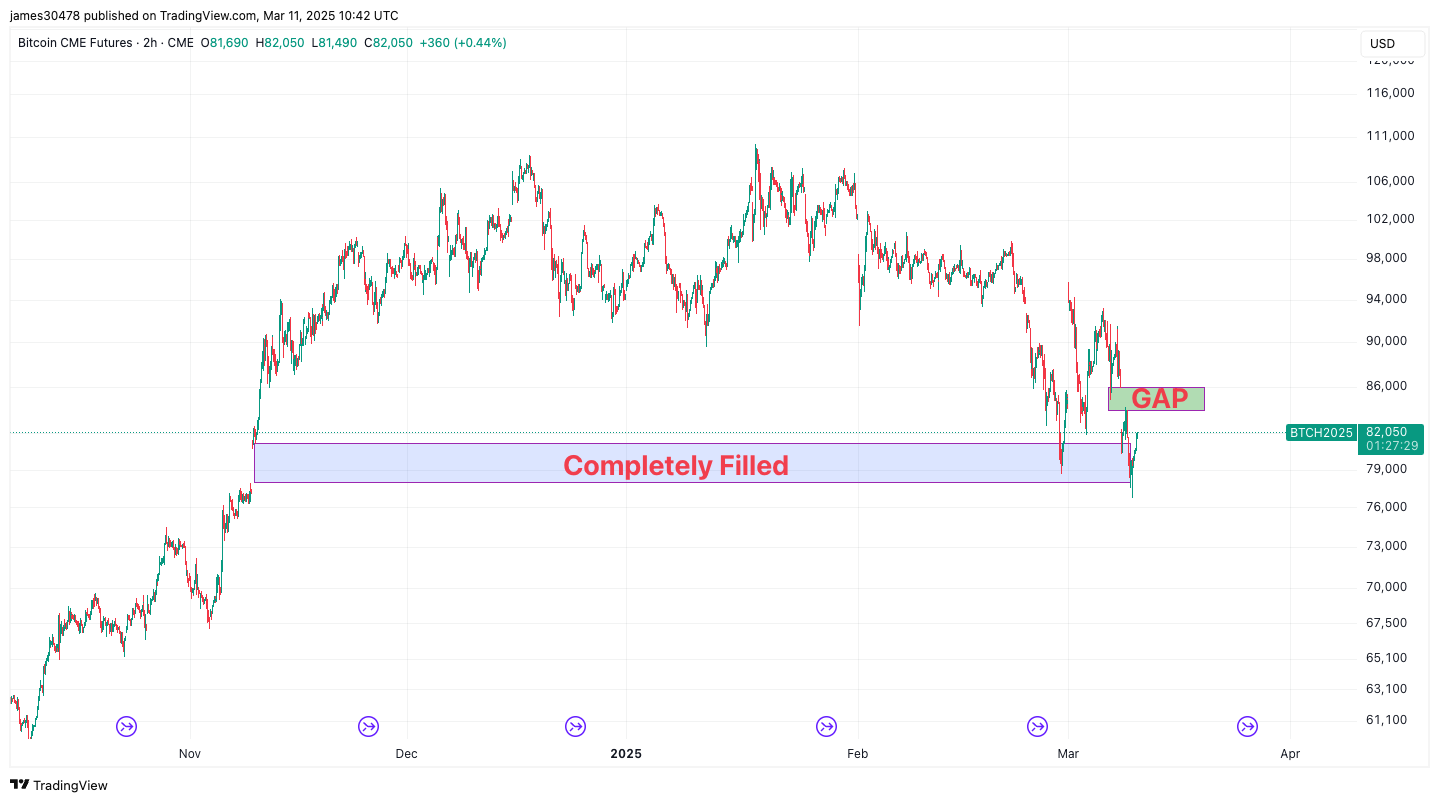
Bitcoin Fills Another CME Futures Gap as BTC Price Drops to $76,700
Bitcoin's price has dropped to $76,700, filling another gap in CME futures, indicating ongoing volatility in the market. Analysts continue to watch for potential short-term movements based on these fills.
Bitcoin
2025-03-11

'Rich Dad Poor Dad' Author Responds to Bitcoin Market Crash: 'I Will Keep Purchasing Bitcoin on Sale'
Robert Kiyosaki advocates for purchasing Bitcoin during its current low prices following a market decline. He views this as a valuable investment opportunity and plans to continue acquiring Bitcoin.
Bitcoin
2025-03-11
Bitcoin Price Falls Below $80,000, Analyst Predictions for the Future
Bitcoin's price has plummeted below $80,000 following days of market volatility, while several analysts offer insights into its future. Additionally, the majority of leading altcoins are also experiencing declines, worrying crypto investors.
Bitcoin
2025-03-11

Market Decline Affects Cryptocurrency Valuations
The cryptocurrency market is facing significant turbulence due to negative sentiments around technology stocks and recession fears, leading to substantial sell-offs, especially impacting Bitcoin and altcoins. Investors are monitoring the situation closely for any trends or cues.
Bitcoin
2025-03-11