
Technical Analysis of Bitcoin from February to March 2025
The cryptocurrency market is currently in a downward trend, characterized by recent price declines and bearish indicators, including a death cross formation and increased selling pressure. Investors are advised to monitor critical support and resistance levels closely.
Article
The cryptocurrency market has certainly become a focal point for investors and enthusiasts alike as it showcases a distinctly bearish trend in recent months. Through careful analysis of the price movements within this volatile market, a pattern has emerged indicating potential risks for short-term and long-term investors. From early October to mid-November 2024, the cryptocurrency market exhibited a promising upward trajectory, sparking optimism among traders. This notable bullish movement raised expectations for sustained growth. However, the euphoria was short-lived as the market encountered obstacles, leading to the emergence of what appears to be a double top pattern—a classic technical analysis indicator of potential reversal. A double top is characterized by two peaks at roughly the same price level, which in this case suggests that the market is struggling to keep its upward momentum. As we transitioned from late November into early February, the situation further deteriorated. By mid-to-late February 2025, the digital currencies seemed to be on a precarious edge, breaking through crucial support levels. The market witnessed a drastic drop on February 25th (UTC), which was a concerning signal reflecting the overwhelming selling pressure. The significant price movements observed during this decline point towards an increasing risk of further downturns in the market. Investors should pay close attention to the key resistance levels that have emerged during this bearish phase. Specifically, resistance is identified at $107,800 and $99,500—these levels mark points at which the cryptocurrency has previously faced selling pressure. Conversely, the support zones are currently located at $91,350 and $82,300, which may provide some cushion against further declines, yet their integrity is questionable under strong selling pressure. In addition to these price levels, the short-term moving averages have crossed beneath long-term ones, indicating a death cross phenomenon. This technical signal often serves as a harbinger of a potential prolonged downward trend, further underscoring the uncertain landscape of the cryptocurrency market. Additionally, the Moving Average Convergence Divergence (MACD) indicator, a widely-used tool among traders, has reflected a concerning scenario indicating bearish momentum. With both the DIF (Difference) and DEA (Signal) metrics dipping below the zero threshold, it becomes increasingly clear that the market sentiment has decisively shifted towards pessimism. Adding to the overall bleak outlook, trading volumes have surged during this recent downturn, demonstrating the selling pressure that has gripped the market. An increase in trading volume, particularly in a declining market, often indicates a strong conviction among sellers. Consequently, this heightened activity reinforces the perception of a downward trend and suggests that many investors are eager to offload their positions. In light of the current scenario, it is imperative for investors to remain vigilant and adaptable. They should closely monitor any breakthroughs at the established key resistance and support levels as these will be critical in determining the future trajectory of the market. Staying informed and reactive in such a volatile environment is essential for navigating through potential pitfalls. In conclusion, while the cryptocurrency market once radiated hope and potential, it has recently succumbed to bearish sentiment. The observed technical indicators, coupled with external market pressures, signify the necessity for a cautious approach from investors. Monitoring the essential price levels alongside market dynamics will be vital in making informed decisions moving forward in this ever-changing landscape.
Keywords
 Bitcoin
2025-03-02
Blockenza Analysis
Based on the current factors such as bearish indicators and increased selling pressure, the price of cryptocurrency is more likely to fall than rise.
FAQs
1. What is the current trend in the cryptocurrency market?
The market is showing a clear downward trend.
2. What was observed in the price movement from October to November 2024?
There was an upward trend followed by a potential double top formation.
3. What happened in the price during mid-to-late February 2025?
The price broke below multiple support levels, leading to a significant drop.
4. What are the critical resistance levels?
The key resistance levels are $107,800 and $99,500.
5. What support levels should be monitored?
The support levels are at $91,350 and $82,300.
6. What does a death cross in moving averages indicate?
It indicates bearish momentum as short-term averages cross below long-term averages.
7. What do the MACD indicator readings suggest?
The MACD readings indicate that the market has entered a bearish phase.
8. Has the trading volume changed recently?
Yes, trading volume has increased during the decline, pointing to significant selling pressure.
9. What should investors do in this market condition?
Investors should exercise caution and monitor key support and resistance levels closely.
10. What does the massive drop on February 25th signify?
It signals significant downside risks for the market.
Related Articles
In this section, you will find articles and analyses related to this post. These materials will help you gain more information about the topic and develop a broader perspective on the digital currency market. By reading these articles, you can make more informed and precise decisions in your investment journey.

Revolutionary Move? Deutsche Bank Predicts Bitcoin Strategic Reserve Will Solidify US Crypto Leadership
Deutsche Bank has announced support for Bitcoin, advocating for a strategic reserve that could bolster the United States' leadership in the cryptocurrency sector. This endorsement could lead to broader acceptance of Bitcoin as a legitimate asset and influence other nations to follow suit.
Bitcoin
2025-03-11

Crypto Industry Demands Regulatory Clarity Over Bitcoin Reserve from Trump
Cryptocurrency executives believe that regulatory clarity in the US is more crucial for the industry than President Trump's initiative to create a national Bitcoin reserve. Trump's recent executive order has left the crypto community craving detailed guidance on regulations and taxation, as they faced significant losses amidst macroeconomic uncertainties.
Bitcoin
2025-03-11
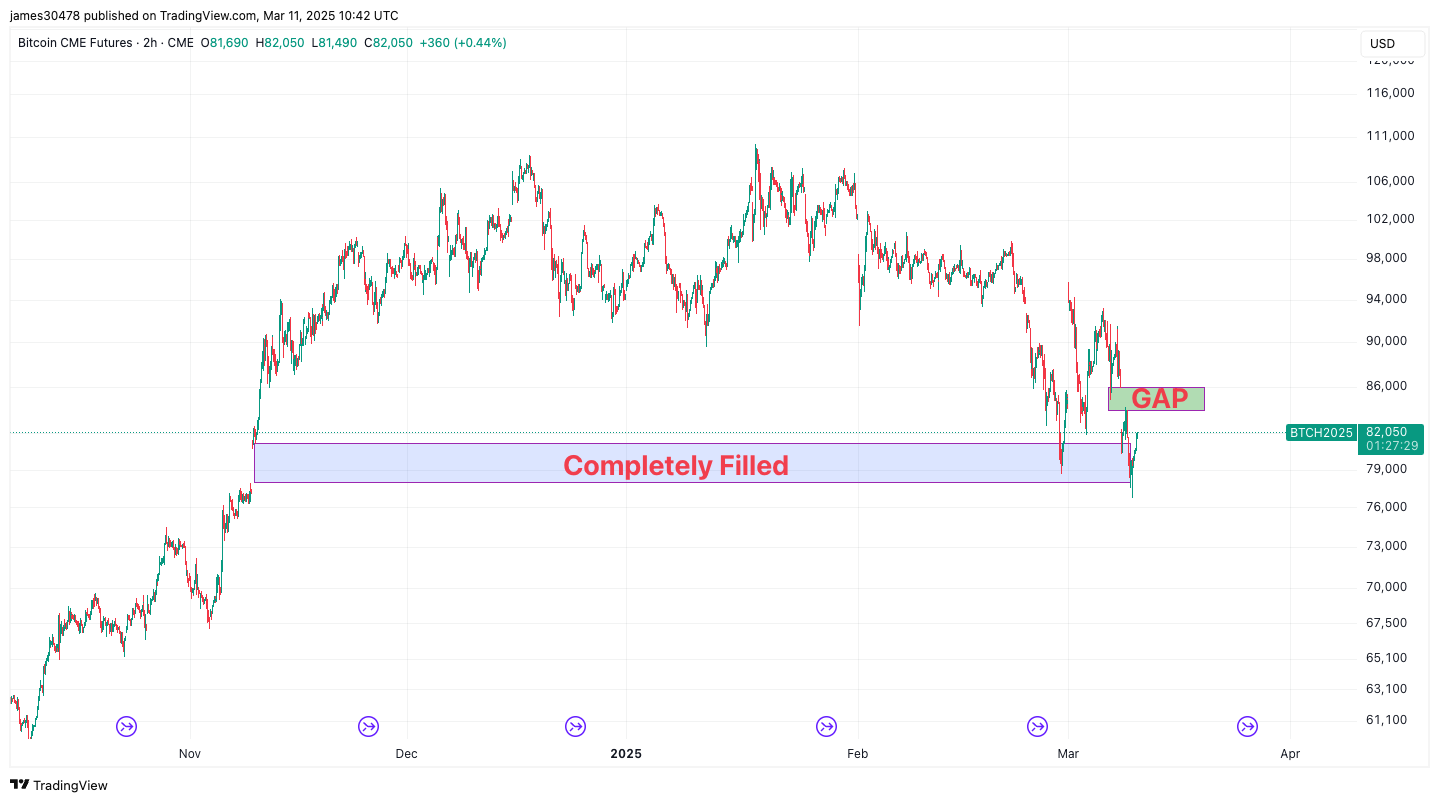
Bitcoin Fills Another CME Futures Gap as BTC Price Drops to $76,700
Bitcoin's price has dropped to $76,700, filling another gap in CME futures, indicating ongoing volatility in the market. Analysts continue to watch for potential short-term movements based on these fills.
Bitcoin
2025-03-11

'Rich Dad Poor Dad' Author Responds to Bitcoin Market Crash: 'I Will Keep Purchasing Bitcoin on Sale'
Robert Kiyosaki advocates for purchasing Bitcoin during its current low prices following a market decline. He views this as a valuable investment opportunity and plans to continue acquiring Bitcoin.
Bitcoin
2025-03-11
Bitcoin Price Falls Below $80,000, Analyst Predictions for the Future
Bitcoin's price has plummeted below $80,000 following days of market volatility, while several analysts offer insights into its future. Additionally, the majority of leading altcoins are also experiencing declines, worrying crypto investors.
Bitcoin
2025-03-11

Market Decline Affects Cryptocurrency Valuations
The cryptocurrency market is facing significant turbulence due to negative sentiments around technology stocks and recession fears, leading to substantial sell-offs, especially impacting Bitcoin and altcoins. Investors are monitoring the situation closely for any trends or cues.
Bitcoin
2025-03-11