
Technical Analysis of Bitcoin from January to March 2025
The market experienced an upward trend followed by fluctuations and a significant pullback, leading to a drop in February 2025. Key resistance and support levels have been identified, and traders should exercise caution amidst a weak market sentiment.
Article
The financial markets are inherently dynamic and exhibit considerable volatility, showcasing fluctuating trends influenced by a multitude of factors. In recent months, particularly from early October to mid-November 2024, we witnessed a pronounced upward trajectory in the market, a period characterized by optimism and significant trading activity. This surge in value, however, was followed by fluctuations that hinted at a potential double top formation — a pattern often indicative of a price reversal that traders should approach with caution. As we moved into early December, the market experienced a notable pullback, signifying a change in momentum juxtaposed against the previous increase. This pullback was more than just a minor correction; it set the stage for what would become an even more dramatic decline in February 2025. The decline brought to light key resistance levels that had formed through the bullish run, which were identified at approximately 98,500, 100,000, 102,500, and ultimately, 105,000. These resistance levels represent price points where selling pressure has historically outweighed buying pressure, providing critical insights for traders assessing future movements. Conversely, crucial support levels, which provide a safety net against declines, were observed at 95,000, 92,500, and 90,000. Most notably, a robust support level at 82,000 was significant in February, serving as a psychological threshold that many traders were closely monitoring. When prices approach these support levels, it is common to see increased buying activity, reflecting market participants' belief that the asset may be undervalued at those points. The trading volumes during this period indicated considerable activity and engagement within the market. Peaks were noted on December 5, 2024, coinciding with the market's pullback, and again on February 3, 2025, during the steep decline. High trading volumes are often indicative of investor sentiment and can signal to market participants the strength or weakness of price movements. Meanwhile, technical indicators such as the Moving Average Convergence Divergence (MACD) have suggested a prevailing weak market sentiment. The MACD is essential for traders as it provides insights into momentum and directionality. However, despite these indications of weakness, recent metrics began to hint at a potential rebound, albeit one that is expected to lack significant momentum. This suggests that while there may be pockets of recovery, the overall trend remains clouded in uncertainty. In light of these developments, it is prudent for traders and investors to remain vigilant regarding significant price levels and market indicators. Despite the potential for short-term recoveries, the overarching long-term trend seems precarious. As such, a careful, methodical approach to trading decisions is recommended. Understanding the market's intricacies, recognizing historical price behavior, and utilizing technical analysis tools will be beneficial in navigating these uncertain waters. In conclusion, the period from late 2024 to early 2025 has been marked by substantial market movements characterized by fluctuations that traders must analyze critically. The combination of resistance and support levels, heavy trading volumes, and the insights gleaned from technical indicators provide a framework for making informed decisions as we continue to navigate through these uncertain economic conditions. As always, exercising caution and remaining aware of the market's sentiments will serve investors well in the long run.
Keywords
 Bitcoin
2025-03-01
Blockenza Analysis
The current market indicators suggest a weak sentiment with potential for small rebounds but overall negative trends, leading to a cautious stance on future price movements.
FAQs
1. What trend did the market show from early October to mid-November 2024?
The market showed an upward trend.
2. What indicator suggests the current market sentiment?
The MACD indicator suggests a weak market.
3. What are the key resistance levels identified?
Key resistance levels are around 98,500, 100,000, 102,500, and 105,000.
4. What was significant about December 5, 2024?
Trading volume peaked on December 5, 2024, corresponding to a pullback.
5. What happened to the market in February 2025?
There was a cliff-like drop in February 2025.
6. What are the key support levels for the market?
Key support levels are around 95,000, 92,500, 90,000, and 82,000.
7. Is a rebound expected in the short-term?
A short-term rebound is possible, but the long-term trend remains unclear.
8. What should traders pay attention to?
Traders should pay attention to the key levels and operate cautiously.
9. What indicates a potential rebound in the market?
Recent signs of rebound, despite limited momentum, indicate a potential recovery.
10. How should traders react to the current market conditions?
It is recommended to operate cautiously due to the unclear long-term trend.
Related Articles
In this section, you will find articles and analyses related to this post. These materials will help you gain more information about the topic and develop a broader perspective on the digital currency market. By reading these articles, you can make more informed and precise decisions in your investment journey.

Revolutionary Move? Deutsche Bank Predicts Bitcoin Strategic Reserve Will Solidify US Crypto Leadership
Deutsche Bank has announced support for Bitcoin, advocating for a strategic reserve that could bolster the United States' leadership in the cryptocurrency sector. This endorsement could lead to broader acceptance of Bitcoin as a legitimate asset and influence other nations to follow suit.
Bitcoin
2025-03-11

Crypto Industry Demands Regulatory Clarity Over Bitcoin Reserve from Trump
Cryptocurrency executives believe that regulatory clarity in the US is more crucial for the industry than President Trump's initiative to create a national Bitcoin reserve. Trump's recent executive order has left the crypto community craving detailed guidance on regulations and taxation, as they faced significant losses amidst macroeconomic uncertainties.
Bitcoin
2025-03-11
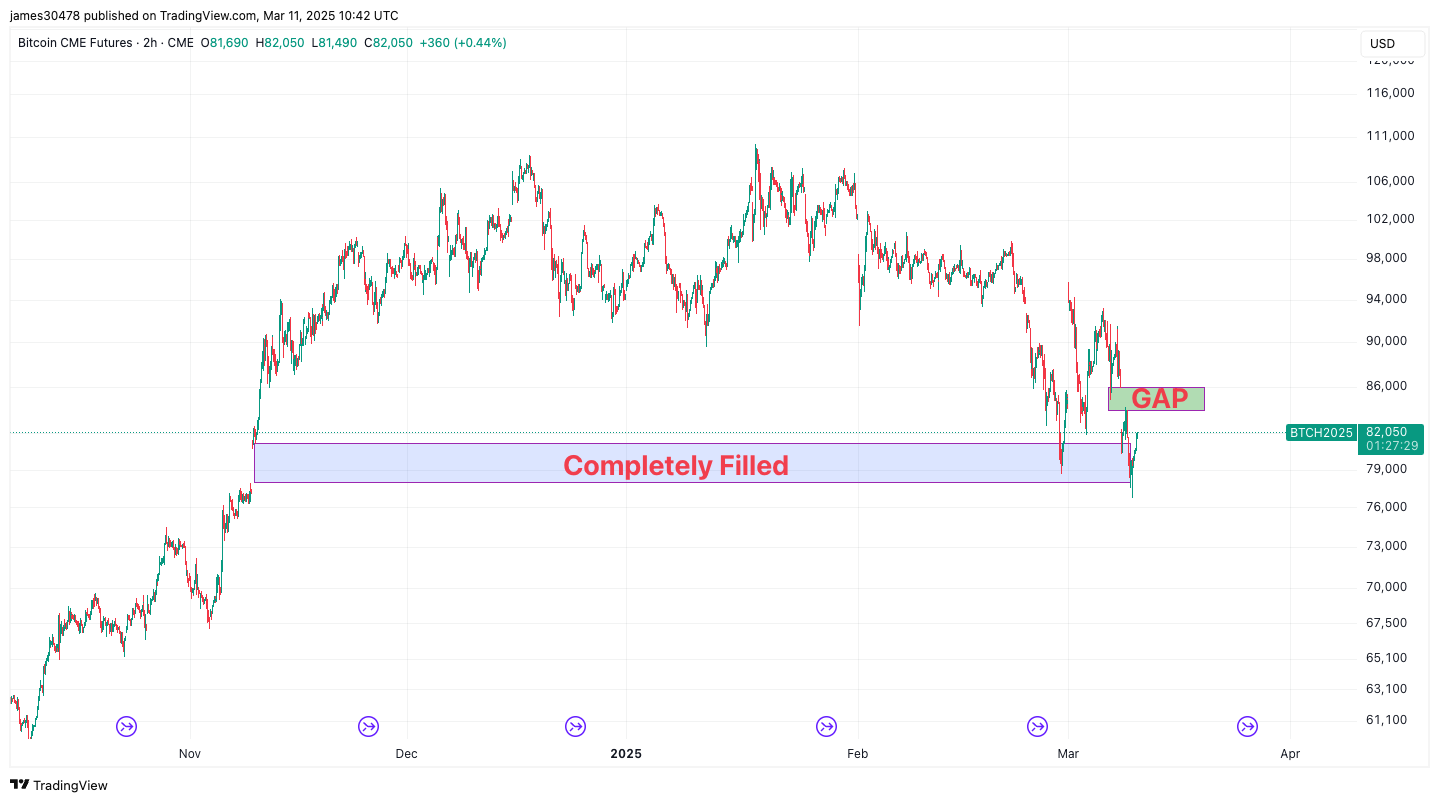
Bitcoin Fills Another CME Futures Gap as BTC Price Drops to $76,700
Bitcoin's price has dropped to $76,700, filling another gap in CME futures, indicating ongoing volatility in the market. Analysts continue to watch for potential short-term movements based on these fills.
Bitcoin
2025-03-11

'Rich Dad Poor Dad' Author Responds to Bitcoin Market Crash: 'I Will Keep Purchasing Bitcoin on Sale'
Robert Kiyosaki advocates for purchasing Bitcoin during its current low prices following a market decline. He views this as a valuable investment opportunity and plans to continue acquiring Bitcoin.
Bitcoin
2025-03-11
Bitcoin Price Falls Below $80,000, Analyst Predictions for the Future
Bitcoin's price has plummeted below $80,000 following days of market volatility, while several analysts offer insights into its future. Additionally, the majority of leading altcoins are also experiencing declines, worrying crypto investors.
Bitcoin
2025-03-11

Market Decline Affects Cryptocurrency Valuations
The cryptocurrency market is facing significant turbulence due to negative sentiments around technology stocks and recession fears, leading to substantial sell-offs, especially impacting Bitcoin and altcoins. Investors are monitoring the situation closely for any trends or cues.
Bitcoin
2025-03-11