
Technical Analysis of Bitcoin on 05-03-2025
The cryptocurrency saw a rise from early October to mid-November 2024 but began to decline in mid-February 2025. With key resistance and support levels identified, and negative indicators suggesting further declines, investors are advised to be cautious.
Article
The cryptocurrency market has always been a breeding ground for volatility, and recent trends in a certain digital currency illustrate this nature perfectly. Between early October and mid-November 2024, this cryptocurrency saw a remarkable rise in value, captivating the attention of investors and traders alike. This period of growth can be attributed to various factors, including increased market adoption, positive news surrounding the project, and a general bullish sentiment that seemed to transcend the cryptocurrency landscape. As the market reached its zenith, however, a significant development occurred— the emergence of a potential double top pattern. A double top is a classic technical analysis pattern that often signals a reversal in trend, and traders closely watch these formations, especially when the price approaches peak levels. It indicates that while buyers initially pushed the price higher, there was a subsequent inability to maintain those levels, potentially foreshadowing a downward trend. By mid-February 2025, the price began to decline sharply, raising concerns among investors and market analysts. This downturn prompted discussions about market corrections and the health of the broader cryptocurrency market. As the price fluctuated, experts identified key resistance levels around 107,000 and 98,500, which appeared to hinder upward momentum. Conversely, key support levels were established at 82,000 and 95,000, acting as psychological and technical barriers where traders may consider re-entering the market or executing buy orders. One of the most significant indicators of market activity was the trading volume, which provides insight into how much of the cryptocurrency is being traded over a specific period. Notably, on November 6, trading volume soared to a recent high of 2,040 coins, suggesting that a flurry of trading activity was occurring, likely spurred by speculation and market developments. This trend continued into February 2025, with trading volumes peaking at 2,356 coins on February 3. Such spikes in trading volume typically indicate increased interest from traders, but they can also lead to heightened volatility. Technical indicators played a critical role in assessing the market's direction during this period. The short-term moving average crossed below the long-term moving average, a phenomenon often referred to as a 'death cross.' This signal, along with negative readings from both the DIF (the difference between the short and long-term moving average) and the DEA (the average of the short-term moving average), communicated a bearish outlook for the cryptocurrency at that time. Given these negative technical indicators, there appears to be a consensus among analysts that the market may continue on its downward trajectory in the short term. This could place investors in a precarious situation, prompting many to adopt a risk-averse strategy, exercising caution as they navigate this unpredictable market environment. Investors and traders must keep abreast of developments that may affect the cryptocurrency's trajectory. Market conditions can shift rapidly based on factors ranging from regulatory news to technological advancements, and a vigilant approach can help mitigate potential losses. In conclusion, while the cryptocurrency exhibited promising growth in late 2024, recent trends signal potential challenges ahead, emphasizing the importance of informed investment strategies in such a tumultuous landscape.
Keywords
 Bitcoin
2025-03-05
Blockenza Analysis
The analysis indicates a bearish trend with indicators suggesting continued price declines. The key resistance levels and negative MACD signals support a cautious stance for investors.
FAQs
1. What trend did the cryptocurrency display from October to November 2024?
The cryptocurrency exhibited an upward trend during that period.
2. What pattern did the price form after mid-November 2024?
It formed a potential double top pattern at high levels.
3. When did the price start to decline?
The price began to decline rapidly starting in mid-February 2025.
4. What are the identified key resistance levels?
Key resistance levels are around 107,000 and 98,500.
5. What are the identified key support levels?
Key support levels are around 82,000 and 95,000.
6. What significant trading volume was reached on November 6?
The trading volume reached a peak of 2,040 coins.
7. What does it indicate when the short-term moving average crosses below the long-term moving average?
It suggests potential further decline in the market.
8. What are the MACD indicators showing?
Both the DIF and DEA are negative, indicating a bearish market.
9. What should investors do in the current market situation?
Investors are advised to exercise caution.
10. What is the overall market outlook according to the text?
The outlook suggests a continuation of the market decline in the short term.
Related Articles
In this section, you will find articles and analyses related to this post. These materials will help you gain more information about the topic and develop a broader perspective on the digital currency market. By reading these articles, you can make more informed and precise decisions in your investment journey.

'Rich Dad Poor Dad' Author Responds to Bitcoin Market Crash: 'I Will Keep Purchasing Bitcoin on Sale'
Robert Kiyosaki advocates for purchasing Bitcoin during its current low prices following a market decline. He views this as a valuable investment opportunity and plans to continue acquiring Bitcoin.
Bitcoin
2025-03-11
Bitcoin Price Falls Below $80,000, Analyst Predictions for the Future
Bitcoin's price has plummeted below $80,000 following days of market volatility, while several analysts offer insights into its future. Additionally, the majority of leading altcoins are also experiencing declines, worrying crypto investors.
Bitcoin
2025-03-11

Market Decline Affects Cryptocurrency Valuations
The cryptocurrency market is facing significant turbulence due to negative sentiments around technology stocks and recession fears, leading to substantial sell-offs, especially impacting Bitcoin and altcoins. Investors are monitoring the situation closely for any trends or cues.
Bitcoin
2025-03-11

Revolutionary Move? Deutsche Bank Predicts Bitcoin Strategic Reserve Will Solidify US Crypto Leadership
Deutsche Bank has announced support for Bitcoin, advocating for a strategic reserve that could bolster the United States' leadership in the cryptocurrency sector. This endorsement could lead to broader acceptance of Bitcoin as a legitimate asset and influence other nations to follow suit.
Bitcoin
2025-03-11

Crypto Industry Demands Regulatory Clarity Over Bitcoin Reserve from Trump
Cryptocurrency executives believe that regulatory clarity in the US is more crucial for the industry than President Trump's initiative to create a national Bitcoin reserve. Trump's recent executive order has left the crypto community craving detailed guidance on regulations and taxation, as they faced significant losses amidst macroeconomic uncertainties.
Bitcoin
2025-03-11
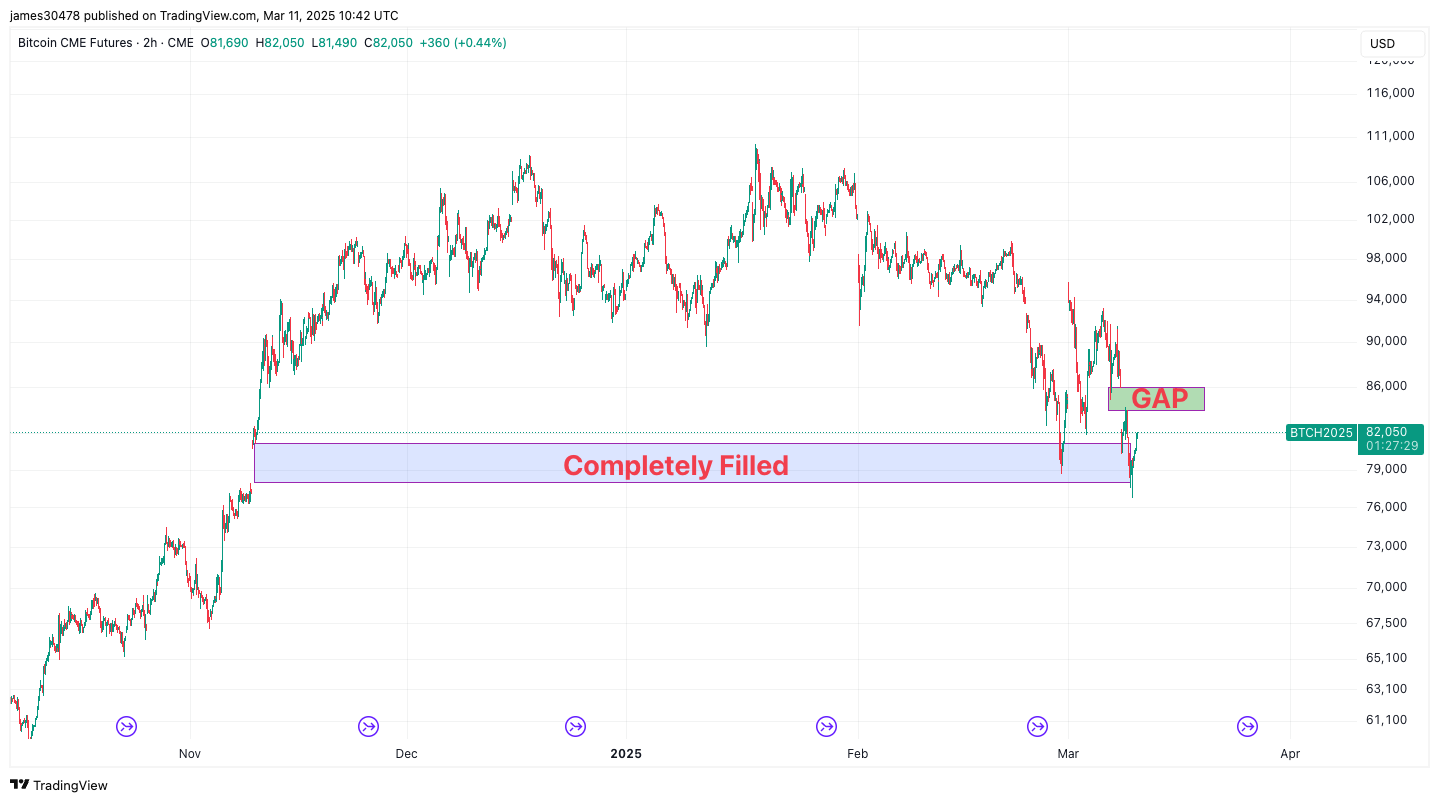
Bitcoin Fills Another CME Futures Gap as BTC Price Drops to $76,700
Bitcoin's price has dropped to $76,700, filling another gap in CME futures, indicating ongoing volatility in the market. Analysts continue to watch for potential short-term movements based on these fills.
Bitcoin
2025-03-11
'Rich Dad Poor Dad' Author Responds to Bitcoin Market Crash: 'I Will Keep Purchasing Bitcoin on Sale'
Robert Kiyosaki advocates for purchasing Bitcoin during its current low prices following a market decline. He views this as a valuable investment opportunity and plans to continue acquiring Bitcoin.
Bitcoin
2025-03-11
Bitcoin Price Falls Below $80,000, Analyst Predictions for the Future
Bitcoin's price has plummeted below $80,000 following days of market volatility, while several analysts offer insights into its future. Additionally, the majority of leading altcoins are also experiencing declines, worrying crypto investors.
Bitcoin
2025-03-11
Market Decline Affects Cryptocurrency Valuations
The cryptocurrency market is facing significant turbulence due to negative sentiments around technology stocks and recession fears, leading to substantial sell-offs, especially impacting Bitcoin and altcoins. Investors are monitoring the situation closely for any trends or cues.
Bitcoin
2025-03-11
Revolutionary Move? Deutsche Bank Predicts Bitcoin Strategic Reserve Will Solidify US Crypto Leadership
Deutsche Bank has announced support for Bitcoin, advocating for a strategic reserve that could bolster the United States' leadership in the cryptocurrency sector. This endorsement could lead to broader acceptance of Bitcoin as a legitimate asset and influence other nations to follow suit.
Bitcoin
2025-03-11
Crypto Industry Demands Regulatory Clarity Over Bitcoin Reserve from Trump
Cryptocurrency executives believe that regulatory clarity in the US is more crucial for the industry than President Trump's initiative to create a national Bitcoin reserve. Trump's recent executive order has left the crypto community craving detailed guidance on regulations and taxation, as they faced significant losses amidst macroeconomic uncertainties.
Bitcoin
2025-03-11
Bitcoin Fills Another CME Futures Gap as BTC Price Drops to $76,700
Bitcoin's price has dropped to $76,700, filling another gap in CME futures, indicating ongoing volatility in the market. Analysts continue to watch for potential short-term movements based on these fills.
Bitcoin
2025-03-11