
Technical Analysis of Bitcoin on February 25, 2025
The market is trending downward, highlighted by a significant drop in late February 2025 that breached a key support level, bearish moving averages, negative MACD indicators, and increased selling pressure. Investors should be cautious and watch for stabilization signals, especially regarding the support level of 91,350.
Article
Title: Understanding the Current Downward Trend in the Market: Key Indicators and Investor Considerations As we move further into 2025, it has become evident that the financial market is in a steep downward trajectory, marked by several alarming indicators. Investors, analysts, and stakeholders across various sectors must pay careful attention to these developments to navigate the increasingly turbulent landscape. In this article, we will explore the current market conditions, highlight pivotal technical indicators, and offer insights on strategic responses for investors. The most striking sign of this downturn is the rapid and steep decline observed during the closing of February 2025 (UTC). A significant drop in prices occurred, which could be described as a market 'crash.' Notably, the index plummeted 4,000 points in just a single day, breaching a critical support level that was previously thought to be robust: 95,250 points. This dramatic fall indicates not only a loss of confidence among investors but also highlights potential underlying economic or geopolitical factors that may be influencing market behavior. Examining technical indicators provides further clarity on the bearish market sentiment. A particularly concerning aspect is the phenomenon known as the 'death cross.' This occurs when a short-term moving average crosses below a long-term moving average, signaling potential future declines. Currently, the short-term moving average is recorded at 95,870 points, while the long-term moving average looms higher at 98,086 points. This alignment underscores a pessimistic outlook for the market, suggesting that a continued downtrend may be on the horizon unless decisive action takes place. Additionally, the MACD (Moving Average Convergence Divergence) indicator is flashing warning signs as well, having slipped into negative territory. The current readings show a DIF (Difference) value of -1,163 and a DEA (Average) of -917.5, both firmly positioned below the zero line. This divergence further illustrates weakening momentum and a lack of bullish sentiment, reinforcing the notion that sellers currently dominate the market. One cannot overlook the aspect of trading volume, which has recently reached 667 units, surpassing that of previous periods. This surge in volume typically indicates increased market activity; however, in this context, it points towards heightened selling pressure rather than a healthy reliance on buying. The sheer volume of sell orders suggests that investors are scrambling to liquidate positions amid fear and uncertainty, which can exacerbate downward momentum and contribute to market volatility. As these indicators paint a grim picture, one critical level for investors to monitor is the 91,350 support level. The ability of the market to maintain this threshold will be of paramount importance in determining whether the downtrend continues or if there might be a potential reversal. If this support level fails to hold, it could trigger further panic selling and contribute to an even steeper decline. In light of the current market conditions and the technical indicators outlined, it is prudent for investors to act with caution. Rather than making impulsive trading decisions driven by fear, it would be wise to wait for clearer signs of market stabilization before committing further capital. This may involve seeking additional analytics, consulting financial advisors, and exploring hedging strategies to protect existing investments against potential losses. In conclusion, the current downward trend in the market is significant and fraught with challenges. Investors must remain vigilant, informed, and patient as they navigate these turbulent waters. By closely monitoring these technical indicators and the overall economic climate, investors can position themselves more effectively to capitalize on future opportunities when the market begins to recover.
Keywords
 Bitcoin
2025-02-25
Blockenza Analysis
Based on the evidence presented, it is likely that the price will continue to fall. With significant bearish indicators and increased selling pressure, the market is not showing signs of recovery.
FAQs
1. What trend is the market currently experiencing?
The market is in a clear downward trend.
2. What significant event occurred at the end of February 2025?
A cliff-like drop occurred, breaking through the critical 95,250 support level.
3. How much did the price decline in a single day?
The decline exceeded 4,000 points.
4. What does the 'death cross' in moving averages indicate?
It indicates a bearish alignment in the market.
5. What are the current values of the MACD indicator?
The DIF is at -1,163 and the DEA is at -917.5.
6. What does a negative MACD indicate?
It indicates bearish momentum in the market.
7. What is the current trading volume?
The trading volume is 667 units.
8. What should investors focus on in the short term?
They should focus on whether the 91,350 support level can be maintained.
9. What is the recommended strategy for investors?
Investors are advised to remain cautious and wait for stabilization signals.
10. What does increased selling pressure indicate?
It indicates that there are more sellers than buyers in the market.
Related Articles
In this section, you will find articles and analyses related to this post. These materials will help you gain more information about the topic and develop a broader perspective on the digital currency market. By reading these articles, you can make more informed and precise decisions in your investment journey.

Revolutionary Move? Deutsche Bank Predicts Bitcoin Strategic Reserve Will Solidify US Crypto Leadership
Deutsche Bank has announced support for Bitcoin, advocating for a strategic reserve that could bolster the United States' leadership in the cryptocurrency sector. This endorsement could lead to broader acceptance of Bitcoin as a legitimate asset and influence other nations to follow suit.
Bitcoin
2025-03-11

Crypto Industry Demands Regulatory Clarity Over Bitcoin Reserve from Trump
Cryptocurrency executives believe that regulatory clarity in the US is more crucial for the industry than President Trump's initiative to create a national Bitcoin reserve. Trump's recent executive order has left the crypto community craving detailed guidance on regulations and taxation, as they faced significant losses amidst macroeconomic uncertainties.
Bitcoin
2025-03-11
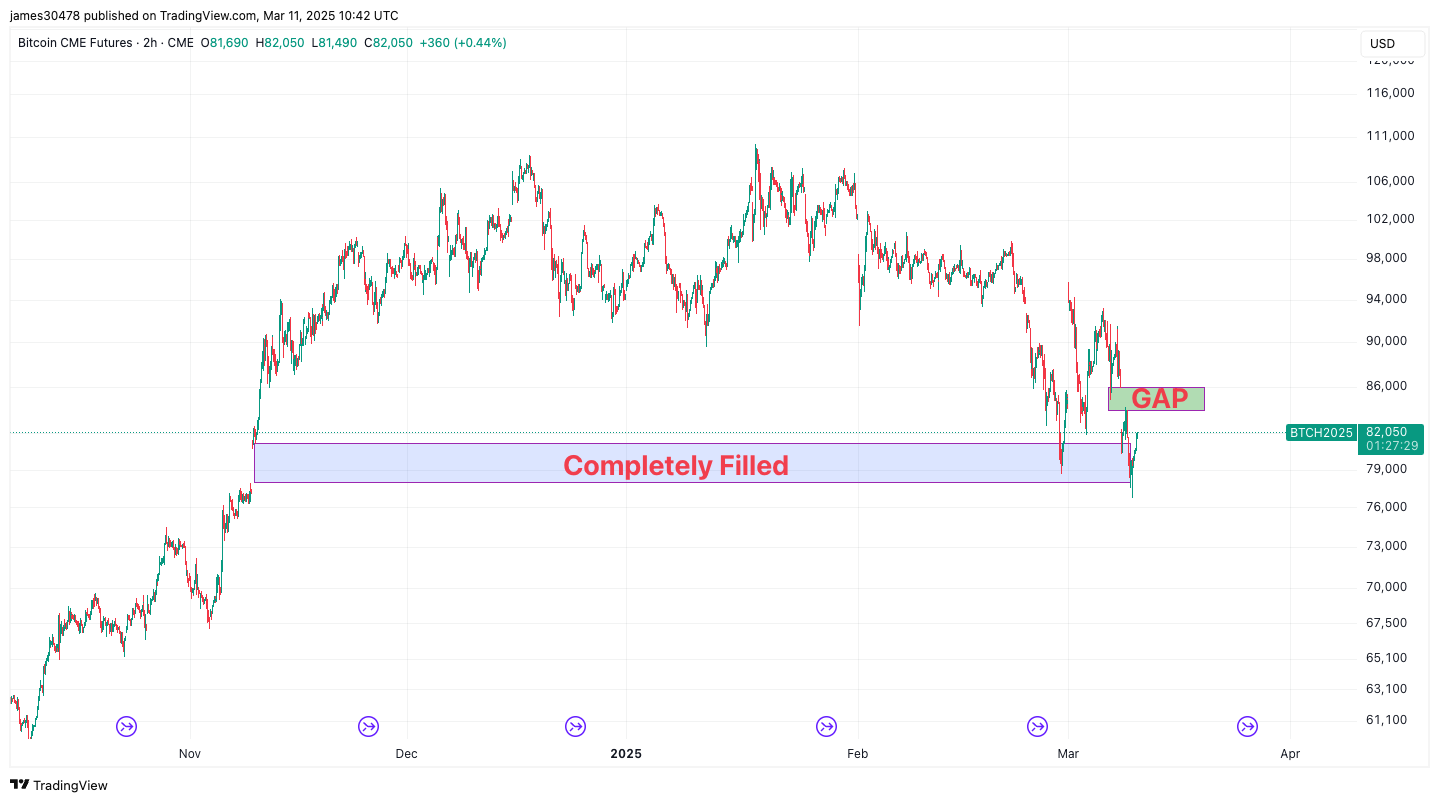
Bitcoin Fills Another CME Futures Gap as BTC Price Drops to $76,700
Bitcoin's price has dropped to $76,700, filling another gap in CME futures, indicating ongoing volatility in the market. Analysts continue to watch for potential short-term movements based on these fills.
Bitcoin
2025-03-11

'Rich Dad Poor Dad' Author Responds to Bitcoin Market Crash: 'I Will Keep Purchasing Bitcoin on Sale'
Robert Kiyosaki advocates for purchasing Bitcoin during its current low prices following a market decline. He views this as a valuable investment opportunity and plans to continue acquiring Bitcoin.
Bitcoin
2025-03-11
Bitcoin Price Falls Below $80,000, Analyst Predictions for the Future
Bitcoin's price has plummeted below $80,000 following days of market volatility, while several analysts offer insights into its future. Additionally, the majority of leading altcoins are also experiencing declines, worrying crypto investors.
Bitcoin
2025-03-11

Market Decline Affects Cryptocurrency Valuations
The cryptocurrency market is facing significant turbulence due to negative sentiments around technology stocks and recession fears, leading to substantial sell-offs, especially impacting Bitcoin and altcoins. Investors are monitoring the situation closely for any trends or cues.
Bitcoin
2025-03-11