
Technical Analysis of Bitcoin on February 26, 2025
The market has exhibited a downward trend, with key support around 86,100-88,000 and resistance at 96,500-97,000. Despite the bearish trend, strong support indicators suggest a potential technical rebound.
Article
The financial market has recently experienced a marked decline, highlighted by a sequence of red candlesticks that emerged on February 24-25, 2025 (UTC). This bearish trend indicates a significant shift in market sentiment and investor confidence, which could potentially lead to further volatility in the near term. Traders and analysts alike are closely watching key levels that could either signal a potential turnaround or further losses. At present, the critical support level is situated between 86,100 and 88,000, a range that many traders will be watching closely to gauge market resilience. A breach of this support could lead to a deeper downturn, whereas stability or a rebound in this range might offer a glimmer of hope for bulls in the market. On the flip side, the primary resistance level is identified to be between 96,500 and 97,000. This barrier is crucial as it represents wider market resistance to upward price movements, often causing traders to reassess their positions as the price approaches this threshold. On February 25, a notable long lower wick was recorded within a price range from 86,100 to 92,551, accompanied by a trading volume of 1.74. This indicates strong buying interest at the lower levels, suggesting that despite current market fear, there is considerable support underpinning prices. The long lower wick reflects buyers stepping in at low prices, which is a classic indication of buying pressure and might hint at a potential reversal if such buying continues. Moreover, technical analysis suggests further caution as the MACD (Moving Average Convergence Divergence) indicator currently rests at -591.3, firmly within the negative territory. The MACD is a trend-following momentum indicator that reflects the relationship between two moving averages of a security's price. Being in the negative zone suggests that the market momentum is still bearish, although it is inching closer to oversold conditions, which could potentially set the stage for a bounce-back. Compounding this complex market situation, the short-term moving average has slipped to 94,883, crossing below the long-term moving average of 97,622. This phenomenon has led to the formation of what's known as a "death cross," a bearish signal often associated with a confirmed trend downward. Such technical patterns can stir anxiety among investors, prompting some to exit their positions to minimize losses, while others see it as an opportunity to buy at lower levels. In conclusion, the current state of the market is entrenched in a downward trend, and the analysis of several indicators supports this perspective. Yet, the presence of long lower wicks at established support levels could signal an impending technical rebound. Traders are advised to closely monitor the 86,100-88,000 range for critical signs of recovery or weakness. The situation remains fluid, with potential for rapid changes, so investors must remain observant and ready to react to any shifts in market dynamics. Overall, balancing caution with potential opportunity will be essential in navigating this precarious market landscape. The coming days will likely reveal whether this recent bearish trend is a precursor to recovery or a deeper downturn.
Keywords
 Bitcoin
2025-02-26
Blockenza Analysis
The recent indicators suggest a continued bearish trend, but the presence of strong support at lower levels presents a chance for short-term recovery.
FAQs
1. What trend has the market shown recently?
The market has shown a clear downward trend.
2. What were the key dates observed for market candles?
February 24-25, 2025.
3. What is the key support level for the market?
The support level is in the range of 86,100-88,000.
4. What is the main resistance level identified?
The main resistance level is between 96,500-97,000.
5. What does the long lower wick on February 25 indicate?
It indicates strong support below and a high level of market panic.
6. What is the status of the MACD indicator?
The MACD bar is -591.3 and remains negative.
7. What moving average phenomena occurred?
The short-term moving average has fallen below the long-term moving average, forming a death cross.
8. What does the presence of long lower wicks suggest?
It suggests the possibility of a technical rebound.
9. What should traders monitor closely?
Traders should monitor the performance of the 86,100-88,000 support level.
10. Is the market currently in a bullish or bearish trend?
The market is still in a downward trend.
Related Articles
In this section, you will find articles and analyses related to this post. These materials will help you gain more information about the topic and develop a broader perspective on the digital currency market. By reading these articles, you can make more informed and precise decisions in your investment journey.

Revolutionary Move? Deutsche Bank Predicts Bitcoin Strategic Reserve Will Solidify US Crypto Leadership
Deutsche Bank has announced support for Bitcoin, advocating for a strategic reserve that could bolster the United States' leadership in the cryptocurrency sector. This endorsement could lead to broader acceptance of Bitcoin as a legitimate asset and influence other nations to follow suit.
Bitcoin
2025-03-11

Crypto Industry Demands Regulatory Clarity Over Bitcoin Reserve from Trump
Cryptocurrency executives believe that regulatory clarity in the US is more crucial for the industry than President Trump's initiative to create a national Bitcoin reserve. Trump's recent executive order has left the crypto community craving detailed guidance on regulations and taxation, as they faced significant losses amidst macroeconomic uncertainties.
Bitcoin
2025-03-11
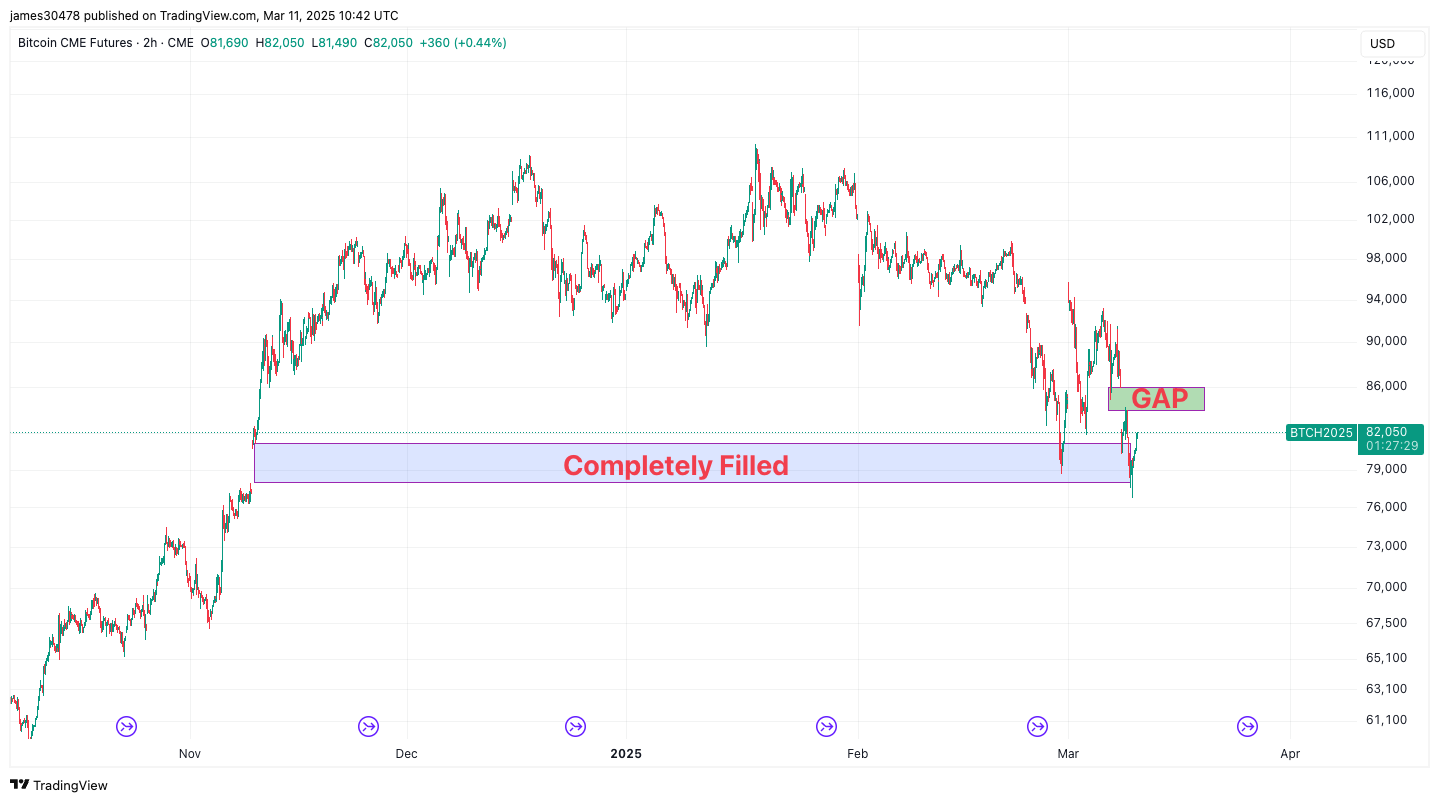
Bitcoin Fills Another CME Futures Gap as BTC Price Drops to $76,700
Bitcoin's price has dropped to $76,700, filling another gap in CME futures, indicating ongoing volatility in the market. Analysts continue to watch for potential short-term movements based on these fills.
Bitcoin
2025-03-11

'Rich Dad Poor Dad' Author Responds to Bitcoin Market Crash: 'I Will Keep Purchasing Bitcoin on Sale'
Robert Kiyosaki advocates for purchasing Bitcoin during its current low prices following a market decline. He views this as a valuable investment opportunity and plans to continue acquiring Bitcoin.
Bitcoin
2025-03-11
Bitcoin Price Falls Below $80,000, Analyst Predictions for the Future
Bitcoin's price has plummeted below $80,000 following days of market volatility, while several analysts offer insights into its future. Additionally, the majority of leading altcoins are also experiencing declines, worrying crypto investors.
Bitcoin
2025-03-11

Market Decline Affects Cryptocurrency Valuations
The cryptocurrency market is facing significant turbulence due to negative sentiments around technology stocks and recession fears, leading to substantial sell-offs, especially impacting Bitcoin and altcoins. Investors are monitoring the situation closely for any trends or cues.
Bitcoin
2025-03-11