
Technical Analysis of Bitcoin on February 27, 2025
The market is exhibiting a strong downward trend, with key indicators signaling bearish conditions and increased selling pressure. It is advisable to remain cautious and wait for signs of market stabilization.
Article
The current market landscape is undergoing a notable downward trend, marked by several critical technical indicators that signal a shift in investor sentiment. This bearish atmosphere has raised concerns among traders, prompting many to analyze the key elements that lead us to this precarious situation. As of recent data, crucial formations in pricing charts reveal a long upper shadow that peaked at 89,500 on November 11, 2024 (UTC). This peak has established a resistance level that the market has struggled to overcome in the subsequent weeks. Following that peak, another significant indicator caught the attention of traders: a bearish engulfing pattern that emerged on December 3, 2024 (UTC). This candlestick pattern reflects the strength of sellers during that session, effectively marking the conclusion of an uptrend that had previously provided optimism to investors. The bearish engulfing pattern is traditionally seen as a strong signal that market momentum may be shifting away from the bulls and into the hands of the bears. Subsequently, this pessimism was exacerbated when the market broke through a substantial support level of 86,100. This decline has since pushed the current price down to approximately 84,225, further solidifying a weak technical outlook for the market. Delving deeper into the technical analysis, moving averages also reflect a bearish alignment. The 7-day moving average stands at 93,111, while the 30-day moving average is notably higher at 97,027. The juxtaposition of these two averages suggests that the short-term trend is significantly lagging behind the longer-term trajectory, a situation that typically raises red flags for investors. When the short-term moving average remains consistently below the long-term moving average, it creates a bearish crossover, signaling potential ongoing declines in price. Moreover, the Moving Average Convergence Divergence (MACD) indicator adds another layer of urgency to the current market narrative. The MACD has displayed negative values for both the DIF (-2,383) and DEA (-1,328) recently, with a swift bearish crossover that offers no indications of a forthcoming bullish divergence. Such a scenario paints a stark picture of the prevailing sales momentum, with no immediate signs of recovery on the horizon. Trading volumes have surged recently, exhibiting heightened selling pressure. On February 25-26, trading volumes recorded were notably significant, with figures reaching 1,744 and 1,439 units, respectively. This increase in volume amidst declining prices serves as an additional warning signal, indicating that sellers are becoming more assertive in the market. The spike in volume during the sell-off could potentially foreshadow further declines if demand does not stabilize or return to optimistic levels. In light of these technical indicators and the current market sentiment, it is prudent for investors to exercise caution. The accumulation of bearish signals suggests that the market may need some time to stabilize before any recovery can be achieved. Investors are advised to remain vigilant and wait for clearer signs that a potential bottom is forming, or signs of a stabilization in momentum, before making any investment decisions in these turbulent times. Patience and prudence may be the best strategies as the market navigates through this challenging phase.
Keywords
 Bitcoin
2025-02-27
Blockenza Analysis
The analysis indicates a strong bearish trend supported by technical indicators, suggesting the price will likely continue to fall.
FAQs
1. What is the current market trend?
The market is in a clear downward trend.
2. What significant level has been breached?
The major support level of 86,100 has been breached.
3. What is the current price of Bitcoin?
The current price is 84,225.
4. What does the moving average system indicate?
The moving average system is in a bearish alignment.
5. What is the status of the MACD indicator?
Both the DIF and DEA of the MACD indicator are negative.
6. When did the bearish engulfing pattern form?
The bearish engulfing pattern formed on December 3, 2024.
7. How has the trading volume changed recently?
Trading volume has increased significantly, indicating increased selling pressure.
8. What price point was reached on November 11, 2024?
A long upper shadow was observed reaching 89,500.
9. What does the current technical outlook suggest?
The current technical outlook is weak.
10. What should traders do in this situation?
It is recommended to maintain caution and wait for signs of stabilization.
Related Articles
In this section, you will find articles and analyses related to this post. These materials will help you gain more information about the topic and develop a broader perspective on the digital currency market. By reading these articles, you can make more informed and precise decisions in your investment journey.

Revolutionary Move? Deutsche Bank Predicts Bitcoin Strategic Reserve Will Solidify US Crypto Leadership
Deutsche Bank has announced support for Bitcoin, advocating for a strategic reserve that could bolster the United States' leadership in the cryptocurrency sector. This endorsement could lead to broader acceptance of Bitcoin as a legitimate asset and influence other nations to follow suit.
Bitcoin
2025-03-11

Crypto Industry Demands Regulatory Clarity Over Bitcoin Reserve from Trump
Cryptocurrency executives believe that regulatory clarity in the US is more crucial for the industry than President Trump's initiative to create a national Bitcoin reserve. Trump's recent executive order has left the crypto community craving detailed guidance on regulations and taxation, as they faced significant losses amidst macroeconomic uncertainties.
Bitcoin
2025-03-11
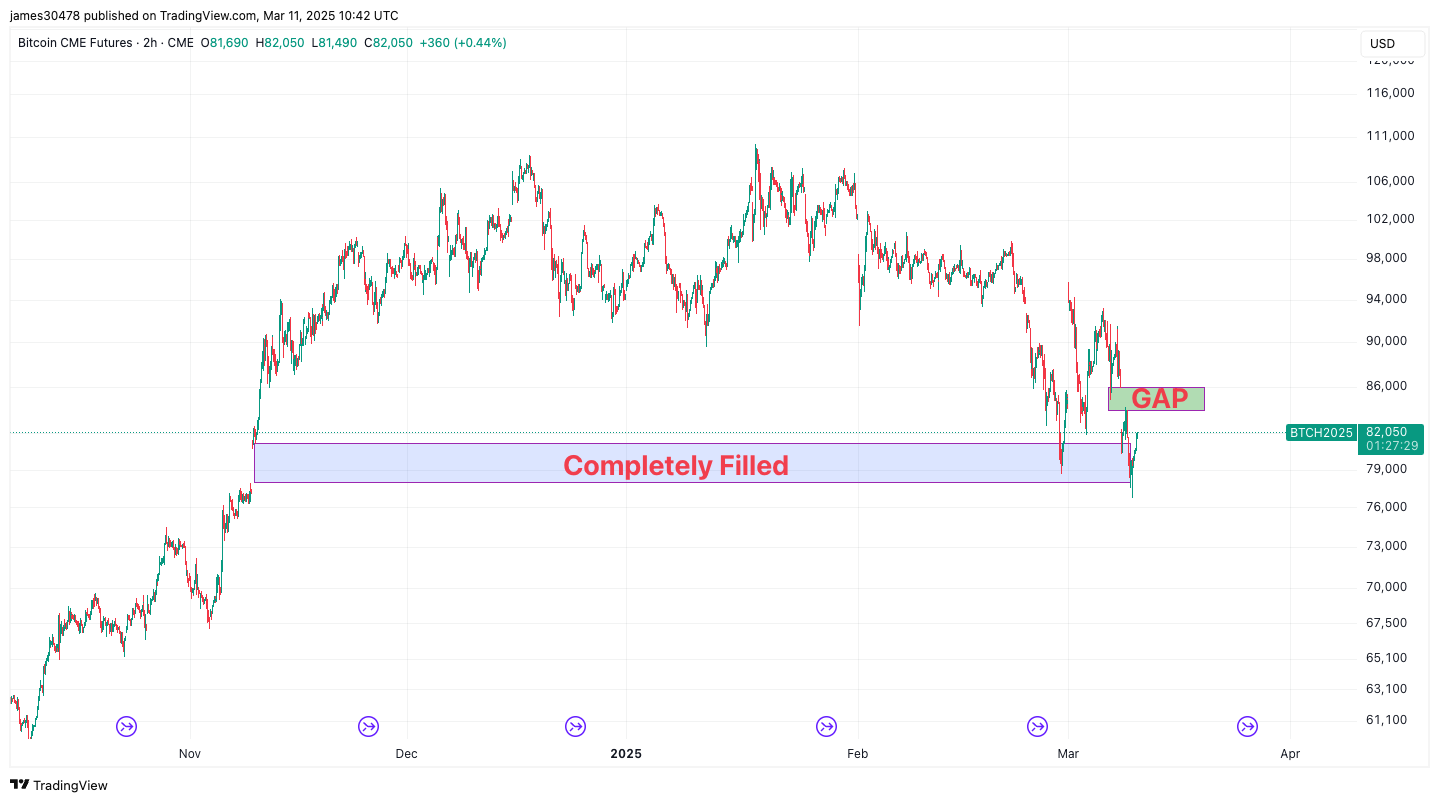
Bitcoin Fills Another CME Futures Gap as BTC Price Drops to $76,700
Bitcoin's price has dropped to $76,700, filling another gap in CME futures, indicating ongoing volatility in the market. Analysts continue to watch for potential short-term movements based on these fills.
Bitcoin
2025-03-11

'Rich Dad Poor Dad' Author Responds to Bitcoin Market Crash: 'I Will Keep Purchasing Bitcoin on Sale'
Robert Kiyosaki advocates for purchasing Bitcoin during its current low prices following a market decline. He views this as a valuable investment opportunity and plans to continue acquiring Bitcoin.
Bitcoin
2025-03-11
Bitcoin Price Falls Below $80,000, Analyst Predictions for the Future
Bitcoin's price has plummeted below $80,000 following days of market volatility, while several analysts offer insights into its future. Additionally, the majority of leading altcoins are also experiencing declines, worrying crypto investors.
Bitcoin
2025-03-11

Market Decline Affects Cryptocurrency Valuations
The cryptocurrency market is facing significant turbulence due to negative sentiments around technology stocks and recession fears, leading to substantial sell-offs, especially impacting Bitcoin and altcoins. Investors are monitoring the situation closely for any trends or cues.
Bitcoin
2025-03-11