
Technical Analysis of Bitcoin on March 11, 2025
The market progressed through an initial rise, followed by fluctuations and a decline between October 2024 and March 2025, with potential bearish signals emerging. Key technical indicators and support/resistance levels suggest a cautious approach moving forward.
Article
The financial market often dances through an array of phases, each signaling shifts in investor sentiment, market dynamics, and economic indicators. From October 2024 to early March 2025, the market showcased a noteworthy rollercoaster of activity through three distinct phases: an initial rise, a period of fluctuation, and a decline that further solidified investors' reservations about future growth. The initial rise, marked by a sharp upward trajectory, reached its pinnacle in early October. It was a time of optimism and enthusiasm, where bullish sentiment took hold, fueling an influx of investments. Factors contributing to this surge could be attributed to a combination of positive earnings reports across various sectors, favorable economic indicators, and broader geopolitical stability, which collectively fostered confidence among investors. Market analysts and traders alike were buoyed, interpreting the movement as a sign of a continuing upward trend. However, as history often teaches us, what goes up must eventually come down. Following this initial surge, the market entered a phase of fluctuation between mid-December and early January. During this time, market volatility was prevalent as traders began to exercise caution. Uncertainty regarding the sustainability of the economic expansion became a prevalent concern. Investors, sensing this vulnerability, shifted towards a more defensive strategy, creating a battleground between bullish and bearish sentiments. During this period, key reversal signals began to emerge. In early November, a potential engulfing reversal formation hinted at the lurking risks, while late February presented signs of an evening star pattern, notorious for indicating market reversals. In observing technical analysis, significant support and resistance levels were established. The support levels pegged at 86,100 (UTC), 91,350 (UTC), and 92,030 (UTC) provided crucial benchmarks for traders assessing downside risks. Conversely, resistance levels at 107,700 (UTC) and 110,000 (UTC) signaled potential barriers to upward momentum. Price movements that approached these thresholds became focal points for traders, who were keenly aware of the implications surrounding market behavior at these levels. Ultimately, the decline that began in late February brought these concerns to fruition. As strong bearish forces took root, the market witnessed a significant pullback, forcing investors to re-evaluate their strategies and expectations. Early signs of a bearish trend were underscored by the emergence of a death cross indicating long-term weakness; this crossover, where the short-term moving average fell below the long-term average, further diminished optimism in the market's potential for recovery. The MACD (Moving Average Convergence Divergence) indicator backed this bearish sentiment. As the Difference (DIF) and Exponential Average (DEA) remained below the zero line, it became evident that the market was entrenched in a downtrend. Traders received a clear message from this indicator, reinforcing the notion that caution must prevail in their trading strategies. In conclusion, the fluctuating market scenario from October 2024 to early March 2025 served as a reminder of the ebbs and flows typical of financial markets. For traders navigating these waters, vigilance is essential. Monitoring key support and resistance levels, coupled with challenging technical indicators like the MACD divergence, is crucial for informed decision-making. As the markets continuously evolve, embracing adaptability and insight will ultimately drive trading success in the ever-changing landscape of financial investment.
Keywords
 Bitcoin
2025-03-11
Blockenza Analysis
The analysis indicates a bearish trend in the market, leading to expectations of a decline in price. Investors should approach the market with caution due to recent downturns and technical indicators suggesting further decreases.
FAQs
1. What stages did the market experience between October 2024 and March 2025?
The market experienced an initial rise, followed by a period of fluctuation, and then a decline.
2. What indicates a risk of correction in the market?
A fluctuation period from mid-December to early January indicated a risk of correction.
3. When did the downward trend in the market begin?
The downward trend began in late February.
4. What are the identified key support levels?
The key support levels are at 86,100 (UTC), 91,350 (UTC), and 92,030 (UTC).
5. What are the identified resistance levels?
The resistance levels are at 107,700 (UTC) and 110,000 (UTC).
6. What is a golden cross?
A golden cross occurs when the short-term moving average crosses above the long-term moving average.
7. What signal followed the golden cross in December?
A death cross appeared after December.
8. What does the MACD indicator show?
The MACD indicator shows a downward trend starting in late February, with DIF and DEA below the zero axis.
9. What trading elements should be monitored?
It’s important to monitor the breakout of key support/resistance levels and MACD divergence.
10. What technical patterns may form?
An engulfing reversal may form in early November, and an evening star may form in late February.
Related Articles
In this section, you will find articles and analyses related to this post. These materials will help you gain more information about the topic and develop a broader perspective on the digital currency market. By reading these articles, you can make more informed and precise decisions in your investment journey.

Revolutionary Move? Deutsche Bank Predicts Bitcoin Strategic Reserve Will Solidify US Crypto Leadership
Deutsche Bank has announced support for Bitcoin, advocating for a strategic reserve that could bolster the United States' leadership in the cryptocurrency sector. This endorsement could lead to broader acceptance of Bitcoin as a legitimate asset and influence other nations to follow suit.
Bitcoin
2025-03-11

Crypto Industry Demands Regulatory Clarity Over Bitcoin Reserve from Trump
Cryptocurrency executives believe that regulatory clarity in the US is more crucial for the industry than President Trump's initiative to create a national Bitcoin reserve. Trump's recent executive order has left the crypto community craving detailed guidance on regulations and taxation, as they faced significant losses amidst macroeconomic uncertainties.
Bitcoin
2025-03-11
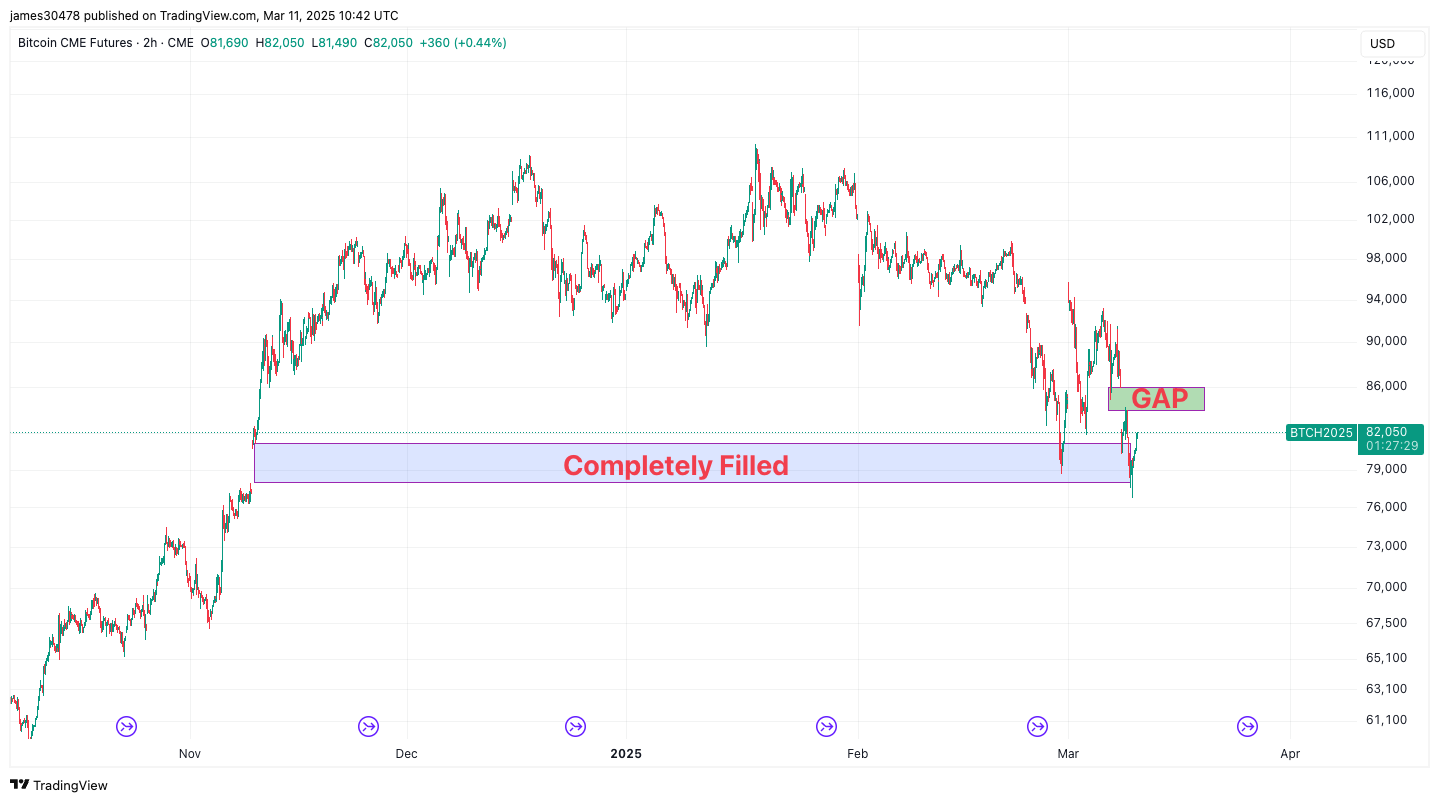
Bitcoin Fills Another CME Futures Gap as BTC Price Drops to $76,700
Bitcoin's price has dropped to $76,700, filling another gap in CME futures, indicating ongoing volatility in the market. Analysts continue to watch for potential short-term movements based on these fills.
Bitcoin
2025-03-11

'Rich Dad Poor Dad' Author Responds to Bitcoin Market Crash: 'I Will Keep Purchasing Bitcoin on Sale'
Robert Kiyosaki advocates for purchasing Bitcoin during its current low prices following a market decline. He views this as a valuable investment opportunity and plans to continue acquiring Bitcoin.
Bitcoin
2025-03-11
Bitcoin Price Falls Below $80,000, Analyst Predictions for the Future
Bitcoin's price has plummeted below $80,000 following days of market volatility, while several analysts offer insights into its future. Additionally, the majority of leading altcoins are also experiencing declines, worrying crypto investors.
Bitcoin
2025-03-11

Market Decline Affects Cryptocurrency Valuations
The cryptocurrency market is facing significant turbulence due to negative sentiments around technology stocks and recession fears, leading to substantial sell-offs, especially impacting Bitcoin and altcoins. Investors are monitoring the situation closely for any trends or cues.
Bitcoin
2025-03-11