
Technical Analysis of Bitcoin on March 3, 2025
The cryptocurrency sees an upward trend until mid-January 2025, followed by fluctuations and a downward trend, with strong resistance levels identified. A breach of key support levels could lead to further price declines, alongside increased selling pressure indicated by trading volumes.
Article
Cryptocurrency markets are notoriously volatile, often reflecting broader economic trends, investor sentiment, and technological advancements. As observed, the particular cryptocurrency in question has shown a significant upward trajectory from early October 2024 to mid-January 2025. This period indicated a potentially bullish market, capturing the attention of both retail and institutional investors who were hopeful about sustained growth. Various factors could have driven this increase, including positive market sentiment stemming from favorable developments in blockchain technology, adoption by major financial institutions, or even regulatory changes that created a more conducive environment for cryptocurrency investments. However, it too often happens that rapid price increases lead to market corrections or consolidations. Following the buoyant period outlined, trading patterns shifted towards fluctuations, and a downward trend began to emerge. This shift is critical for traders and investors to analyze, as it underscores the cyclical nature of cryptocurrencies and the necessity for strategic entry and exit points. Key resistance levels have been established during this weakening phase; particularly noted are thresholds at 107,700 on December 16, 2024, 108,350 on December 17, 2024, and 110,000 on January 20, 2025. The fact that these price points have been tested multiple times without any decisive breakthroughs emphasizes the strong resistance posed by sellers in the market. Each time the cryptocurrency approached these resistance levels, it was met with substantial selling pressure, indicating that market participants are cautious about pushing prices higher at this juncture. On the flip side, key support levels have emerged, notably at 82,300 on February 26, 2025, and 78,300 on February 28, 2025. These support levels serve as crucial indicators of where the price may stabilize. However, if these thresholds are breached, it could trigger further bearish activity and lead to deeper price declines. Investors must remain vigilant to prevent potential losses should the market continue to exhibit weakness. As the end of February 2025 approached, not only did we see a decline in price, but this was also accompanied by a notable increase in trading volume. This volume surge hints at intensifying selling pressure, often suggesting that traders are liquidating their positions in anticipation of further downward movement. Analyzing trading volume alongside price trends is vital, as it could provide insights into the strength of the current market sentiment. Further complicating the outlook is the MACD (Moving Average Convergence Divergence) indicator, which is a popular tool for gauging momentum in financial markets. Currently, this indicator suggests a weakening trend for the crypto asset in question, as the short-term moving average is observed to remain below the long-term moving average. This pattern typically indicates ongoing short-term declines. Nevertheless, it’s important to closely monitor potential rebound opportunities, as markets often exhibit a form of cyclical behavior, where price pullbacks can lead to eventual recovery. In summary, the journey of this cryptocurrency from October 2024 to early 2025 illustrates the unpredictable nature of digital assets. The interplay of resistance and support levels, coupled with increased trading volume and MACD indicators, provides invaluable insights for traders looking to navigate the uncertain waters of cryptocurrency markets. As always, thorough research and informed decision-making remain paramount for anyone participating in this thrilling yet risky financial landscape.
Keywords
 Bitcoin
2025-03-03
Blockenza Analysis
The overall indicators, including high selling pressure and bearish trends, suggest a negative outlook for the cryptocurrency's price, warranting caution for investors.
FAQs
1. What is the overall trend of this cryptocurrency from October 2024 to January 2025?
The cryptocurrency shows an upward trend from early October 2024 to mid-January 2025.
2. What are the key resistance levels identified?
Key resistance levels are 107,700, 108,350, and 110,000.
3. What supports levels should be monitored?
Key support levels are 82,300 and 78,300.
4. What indicates increased selling pressure in late February 2025?
The price decline accompanied by an increase in trading volume indicates increased selling pressure.
5. What does the MACD indicator suggest?
The MACD indicates a weakening market with potential for continued short-term declines.
6. What can happen if support levels are breached?
A breach of the support levels may trigger further declines in price.
7. How many times have the resistance levels been tested?
The resistance levels have been tested multiple times without a breakthrough.
8. What time frame is being analyzed in this article?
The analysis covers the period from October 2024 to March 2025.
9. What might happen after the bearish trends?
Rebound opportunities should be monitored following the bearish trends.
10. What indicates a potential rebound in the market?
Monitoring for rebound opportunities as the market shows weakening trends may indicate potentials for recovery.
Related Articles
In this section, you will find articles and analyses related to this post. These materials will help you gain more information about the topic and develop a broader perspective on the digital currency market. By reading these articles, you can make more informed and precise decisions in your investment journey.

Revolutionary Move? Deutsche Bank Predicts Bitcoin Strategic Reserve Will Solidify US Crypto Leadership
Deutsche Bank has announced support for Bitcoin, advocating for a strategic reserve that could bolster the United States' leadership in the cryptocurrency sector. This endorsement could lead to broader acceptance of Bitcoin as a legitimate asset and influence other nations to follow suit.
Bitcoin
2025-03-11

Crypto Industry Demands Regulatory Clarity Over Bitcoin Reserve from Trump
Cryptocurrency executives believe that regulatory clarity in the US is more crucial for the industry than President Trump's initiative to create a national Bitcoin reserve. Trump's recent executive order has left the crypto community craving detailed guidance on regulations and taxation, as they faced significant losses amidst macroeconomic uncertainties.
Bitcoin
2025-03-11
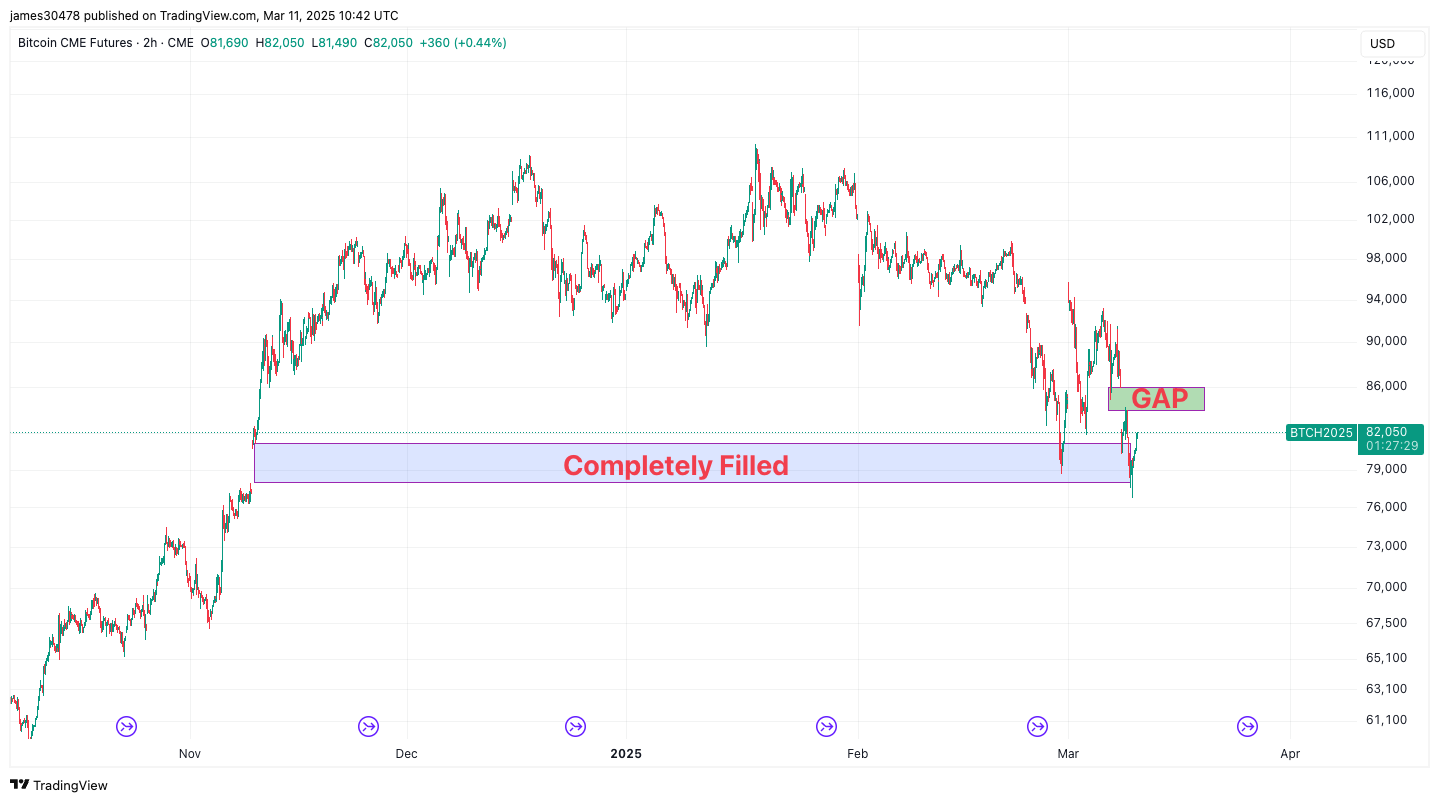
Bitcoin Fills Another CME Futures Gap as BTC Price Drops to $76,700
Bitcoin's price has dropped to $76,700, filling another gap in CME futures, indicating ongoing volatility in the market. Analysts continue to watch for potential short-term movements based on these fills.
Bitcoin
2025-03-11

'Rich Dad Poor Dad' Author Responds to Bitcoin Market Crash: 'I Will Keep Purchasing Bitcoin on Sale'
Robert Kiyosaki advocates for purchasing Bitcoin during its current low prices following a market decline. He views this as a valuable investment opportunity and plans to continue acquiring Bitcoin.
Bitcoin
2025-03-11
Bitcoin Price Falls Below $80,000, Analyst Predictions for the Future
Bitcoin's price has plummeted below $80,000 following days of market volatility, while several analysts offer insights into its future. Additionally, the majority of leading altcoins are also experiencing declines, worrying crypto investors.
Bitcoin
2025-03-11

Market Decline Affects Cryptocurrency Valuations
The cryptocurrency market is facing significant turbulence due to negative sentiments around technology stocks and recession fears, leading to substantial sell-offs, especially impacting Bitcoin and altcoins. Investors are monitoring the situation closely for any trends or cues.
Bitcoin
2025-03-11