
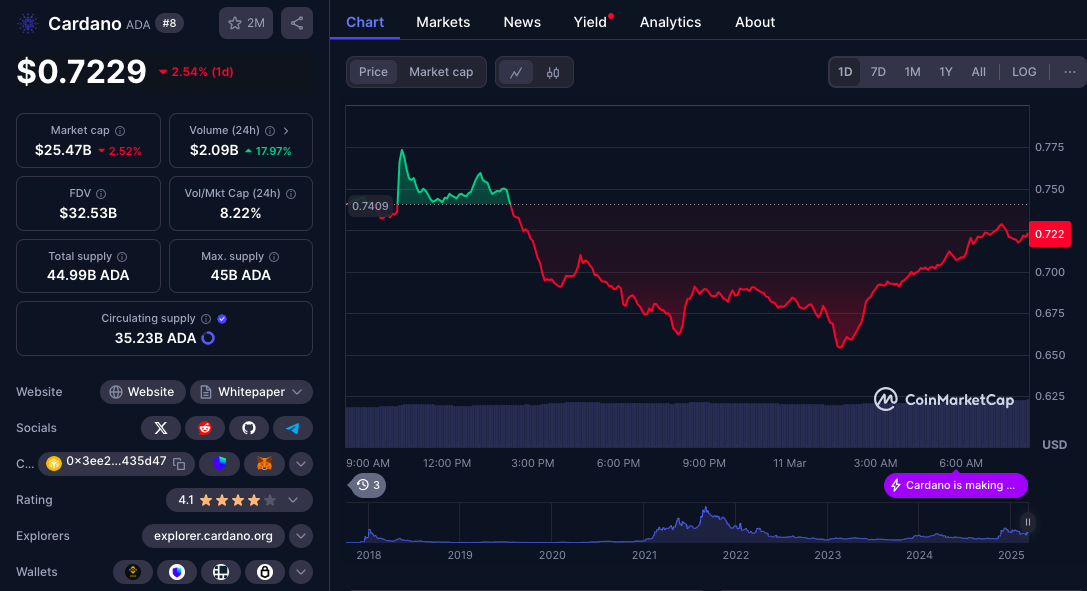
Technical Analysis of Cardano on February 26, 2025
The market is currently in a downward trend with pivotal support levels identified at 0.6307, 0.7349, and 0.8600. Signs of a potential reversal are emerging, suggesting that if the 0.6307 support holds, a possible uptrend could begin.
Article
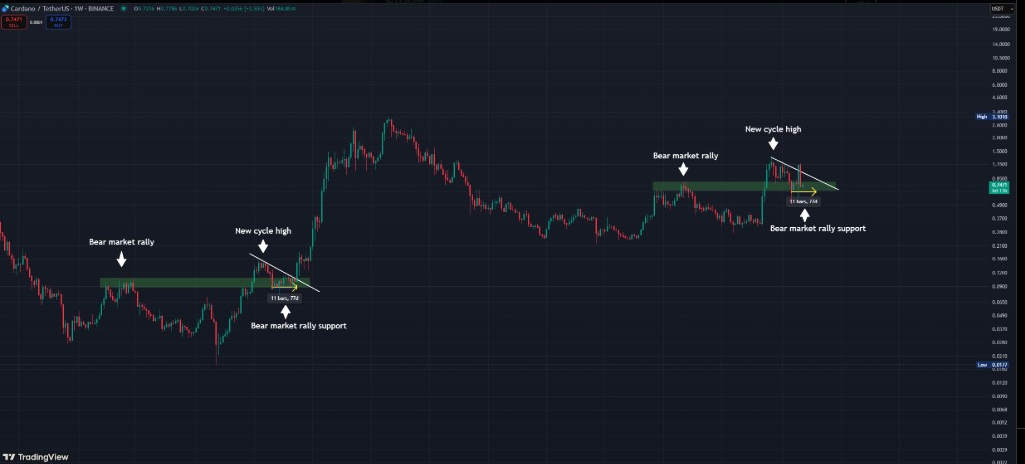
As the financial markets navigate through a downward trend, traders and investors alike are closely monitoring the indicators that could signify a potential reversal in this bear market. In recent weeks, notable patterns and significant support and resistance levels have come into play that could impact future market activity. For those who are currently assessing their positions and strategies, understanding these dynamics can help inform their decisions moving forward. In the current market environment, essential support levels have been identified at 0.6307, 0.7349, and 0.8600, while resistance levels are notably at 1.158, 0.8308, and 0.7876. At present, the market price rests at 0.6832, indicating a proximity to the first key support level at 0.6307. Understanding these levels is crucial for traders; support levels often act as price floors where buying interest may emerge, while resistance levels signify areas where selling pressure tends to mount, which could lead to price reversals. One of the most noteworthy aspects of the market’s recent activity was a bullish rally observed from November 22 to 24, 2024, where market prices peaked at 1.158. This surge illustrated a brief moment of optimism, painting a picture of potential gains for investors. However, following this uptick, the market faced challenges, most notably through a bearish engulfing pattern that unfolded between February 13 and 15, 2025. This formation, which indicates that a recent bullish trend has been overtaken by sellers, serves as a signal of possible waning upward momentum. The presence of this pattern exposes the fragility of the recent rally and the market's susceptibility to downward pressure. On February 24 to 25, a long lower wick emerged in the price candlestick formations, suggesting that buyers are willing to step in at lower price levels and defend against further declines. This development hints at the presence of significant support, reinforcing the idea that 0.6307 is a critical psychological and technical level for the market. Should prices hold above this area, traders may interpret it as a sign of resilience ahead. Furthermore, the Moving Average Convergence Divergence (MACD) indicator, which traders often use to identify trend direction and momentum, shows a convergence of its two lines—DIF at -0.03756 and DEA at -0.03629. This convergence is notable as it can indicate a potential change in market direction, particularly if the lines cross and begin moving upwards. MACD indicators are typically used in conjunction with other technical analysis tools, yet the current readings warrant attention for any signs of a durable recovery. Given the existing market conditions and the emerging signals from technical analysis, it may be in traders' best interests to wait for confirmation that the support level at 0.6307 holds. A successful bounce off this price point could open the door for a new uptrend, where bullish sentiment might reenter the market. However, caution is advised, as the market's recent bearish engulfing pattern indicates that risk remains prevalent. In conclusion, while the market currently finds itself in a downward trend, astute observers can identify key indicators that suggest the potential for a rebound. By focusing on critical support and resistance levels, alongside monitoring patterns and indicators such as the MACD, traders can position themselves advantageously to capitalize on future developments in this uncertain yet evolving market landscape.
Keywords
 Cardano
2025-02-26
Blockenza Analysis
The current analysis indicates a slight potential for the price to rise, supported by key formations and indicators that suggest a reversal could be in progress if key support is sustained.
FAQs
1. What is the current price of the market?
The current price is 0.6832.
2. What are the main support levels?
The main support levels are 0.6307, 0.7349, and 0.8600.
3. What are the resistance levels?
The resistance levels are 1.158, 0.8308, and 0.7876.
4. What signifies the bearish engulfing pattern?
It indicates a loss of upward momentum.
5. What does the long lower wick indicate?
It indicates strong support at lower levels.
6. What do the MACD indicators suggest?
They are converging, signaling a potential reversal.
7. What is the recommended action regarding the 0.6307 support level?
It is recommended to wait for this support level to be confirmed.
8. What could happen if the 0.6307 support level holds?
A new uptrend may begin if the support level holds.
9. What was the range of the bullish rally?
The bullish rally occurred from November 22 to 24, 2024, reaching a high of 1.158.
10. What were the dates of the bearish pattern?
The bearish engulfing pattern appeared from February 13 to 15, 2025.
Related Articles
In this section, you will find articles and analyses related to this post. These materials will help you gain more information about the topic and develop a broader perspective on the digital currency market. By reading these articles, you can make more informed and precise decisions in your investment journey.

Cardano Faces Challenges at $0.80: Future Price Movement Depends on Bulls' Defense
Cardano (ADA) is at a critical support level of $0.80, and its future price movement depends on maintaining this range or risk falling deeper. Investors should remain vigilant as market dynamics will play a crucial role in shaping ADA's next steps.
Cardano
2025-03-11

The Magic Line: Key Support Level at $74,000 Determines Bitcoin's Bull or Bear Future
Bitcoin has recently faced a major correction, dropping 27.52% and currently hovering around the critical support level of $74,000, which is indicative of market sentiment and a historical buffer against bear markets. With fears of a recession and volatility impacting investor behavior, experts suggest a potential entry point for investors between $52,000 and $60,000 if BTC continues to decline.
Cardano
2025-03-11

Cardano: Is ADA Setting Up a Bear Trap Before a 2021-Style Breakout?
Cardano's ADA may be forming a classic bear trap that could lead to a breakout akin to its performance in 2021. Analysts are observing key price levels to determine the direction of ADA's future movements.
Cardano
2025-03-11
Cardano (ADA) Faces Key Resistance at $0.80—Will It Breakout or Drop Further?
Cardano (ADA) is trading within a critical support range of $0.66 and $0.80, and traders are monitoring its performance amid market volatility. In the last 24 hours, ADA has declined by 2.65%, raising concerns about further drops.
Cardano
2025-03-11

Ethereum (ETH) Strategic Reserve, Binance Coin (BNB) Hard Fork, and BitLemons Seizing the Moment
The cryptocurrency market presents various opportunities, highlighting BitLemons ($BLEM) as it approaches the end of its presale, while Ethereum upgrades and Binance Coin prepares for a hard fork. BitLemons boasts a functioning Web3 gaming platform and commitment to value creation, making it an appealing option for early investors.
Cardano
2025-03-11
What's Next for Cardano Price as Whales Accumulate 180 Million ADA
Cardano (ADA) has seen significant whale accumulation, with investors acquiring over 180 million ADA tokens, indicating renewed institutional interest. This trend points towards potential price stabilization and growth for Cardano in the long run.
Cardano
2025-03-11