
Technical Analysis of Cardano on February 27, 2025
The market is in a downward trend with significant technical patterns indicating a potential reversal, while key support levels are being tested. Caution is advised as the current price approaches critical support and negative indicators signal bearish dominance.
Article
The current state of the market reveals a substantiated downward trend that traders and investors must navigate carefully. Recent market analyses point towards significant technical formations that indicate potential shifts in price momentum. From January 15 to January 17 (UTC), a three-day upward candlestick pattern emerged, raising hopes among bulls; however, this optimism has rapidly been dampened by a subsequent bearish Doji candlestick formation that has taken shape from January 19 to 20 (UTC). This pattern generally signifies indecision among traders and can often be a precursor to a market top reversal, suggesting that a decline may be imminent. Key price levels serve as critical markers in this ongoing analysis. Significant support lines have been established at 0.5177 and 0.6307, while resistance is firmly situated at 1.158. Currently, the trading price hovers around 0.6474, which is perilously close to the aforementioned support level of 0.6307. This proximity to a support line indicates heightened vulnerability; a breach below this level could lead to a more pronounced downturn, potentially driving prices closer to the next support level at 0.5177. Technical indicators such as the Moving Average Convergence Divergence (MACD) further elucidate the current market conditions. The MACD indicates a stark bearish sentiment, with values recorded at DIF: -0.04301 and DEA: -0.03763, both of which remain firmly in negative territory. This suggests that sellers continue to exert control over the market, reinforcing the likelihood of further declines. Moreover, a volume analysis reveals that while trading activity surged during the past price decline, it has recently contracted to approximately 8,846 units, indicating a wait-and-see approach among traders; investors seem hesitant to make moves without clearer signs of a reversal or stabilization. In terms of a short-term trading strategy, the emphasis must be placed on vigilance regarding the established support level of 0.6307. Should the market breach this threshold, it could signal a more significant decline towards the lower support level at 0.5177. Under these current negative conditions, it is unwise for traders to engage in 'bottom-fishing'—a strategy that involves buying stocks at low prices in the hope that they will rebound. Instead, a more prudent approach would be to observe the market for signs of stabilization. Traders should look for consolidations, reversals, or other confirming patterns before committing additional capital. In conclusion, the market landscape is currently characterized by a notable bearish sentiment compounded by significant technical indicators and support levels. Traders and investors alike must remain vigilant and exercise caution in their trading activities. The looming threats of a breach below the critical support level necessitate a strategic pause to observe market behavior. By maintaining a careful watch on volume trends and support/resistance dynamics, traders can position themselves more advantageously when the market stabilizes, allowing for potentially profitable opportunities when the overall sentiment shifts toward the bullish side once again. It remains crucial to act informed, leveraging both technical analysis and market sentiment as guiding variables in the face of ongoing market volatility.
Keywords
 Cardano
2025-02-27
Blockenza Analysis
The analysis indicates a bearish trend with negative indicators suggesting the price is likely to fall. Caution is advised as current price levels test important support zones.
FAQs
1. What recent candlestick patterns were observed?
A three-day upward candlestick pattern was observed from January 15-17, followed by a bearish Doji pattern from January 19-20.
2. What are the important support levels mentioned?
The important support levels are 0.5177 and 0.6307.
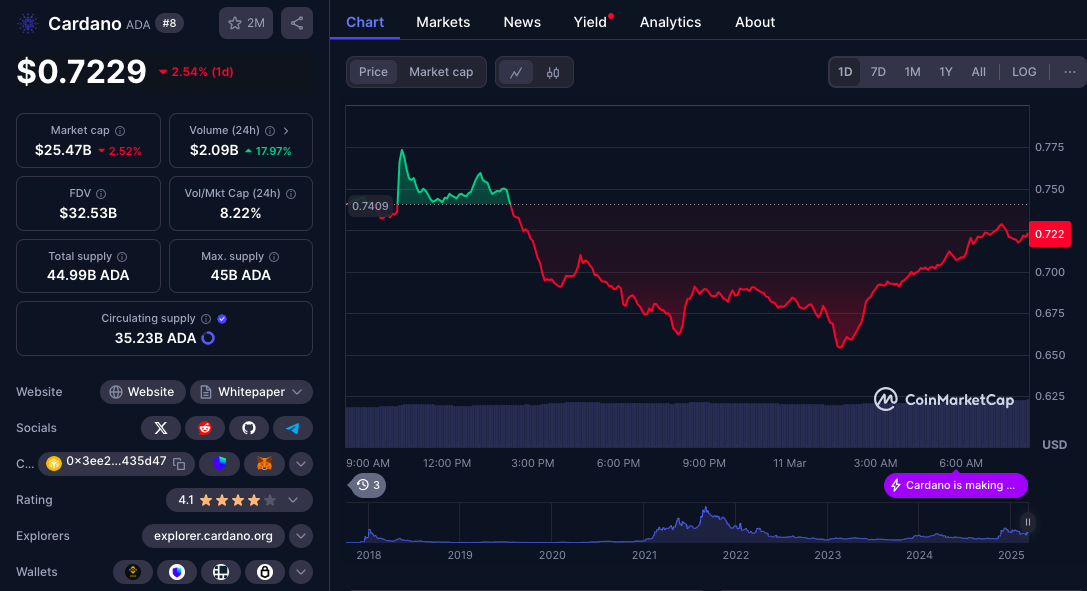
3. What is the current price of Cardano?
The current price is 0.6474.
4. What does the MACD indicator indicate?
The MACD indicator is negative, indicating bearish dominance.
5. What does volume analysis show?
Volume analysis shows increased trading volume during declines, but it has recently contracted to 8,846 units.
6. What is the short-term recommendation?
The short-term recommendation is to wait for the 0.6307 support level to play out before making decisions.
7. What should traders be cautious about?
Traders should be cautious of further downside if the support level at 0.6307 is breached.
8. Is it recommended to bottom-fish currently?
No, it is not recommended to bottom-fish at this time.
9. What signals should traders wait for?
Traders should wait for stabilization signals before taking action.
10. What does the bullish reversal suggest?
The bearish Doji suggests a potential top reversal in the market.
Related Articles
In this section, you will find articles and analyses related to this post. These materials will help you gain more information about the topic and develop a broader perspective on the digital currency market. By reading these articles, you can make more informed and precise decisions in your investment journey.

Cardano Faces Challenges at $0.80: Future Price Movement Depends on Bulls' Defense
Cardano (ADA) is at a critical support level of $0.80, and its future price movement depends on maintaining this range or risk falling deeper. Investors should remain vigilant as market dynamics will play a crucial role in shaping ADA's next steps.
Cardano
2025-03-11

The Magic Line: Key Support Level at $74,000 Determines Bitcoin's Bull or Bear Future
Bitcoin has recently faced a major correction, dropping 27.52% and currently hovering around the critical support level of $74,000, which is indicative of market sentiment and a historical buffer against bear markets. With fears of a recession and volatility impacting investor behavior, experts suggest a potential entry point for investors between $52,000 and $60,000 if BTC continues to decline.
Cardano
2025-03-11

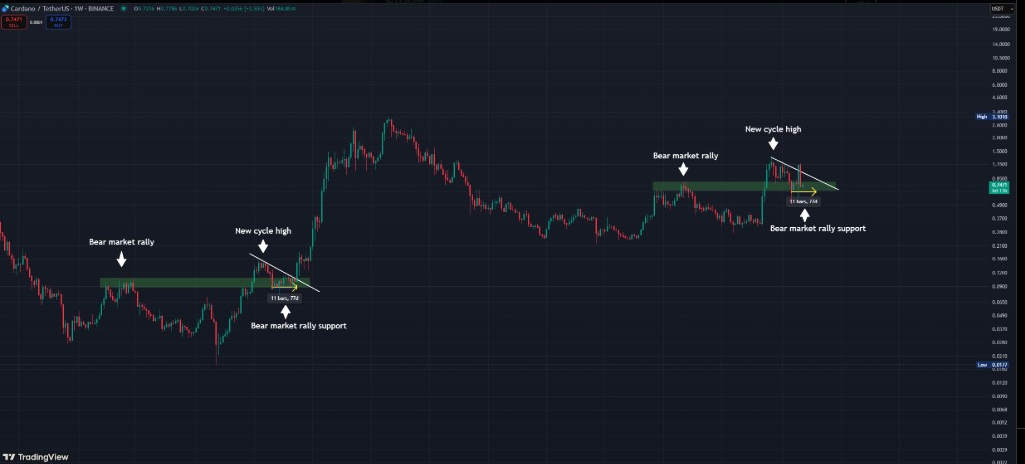
Cardano: Is ADA Setting Up a Bear Trap Before a 2021-Style Breakout?
Cardano's ADA may be forming a classic bear trap that could lead to a breakout akin to its performance in 2021. Analysts are observing key price levels to determine the direction of ADA's future movements.
Cardano
2025-03-11
Cardano (ADA) Faces Key Resistance at $0.80—Will It Breakout or Drop Further?
Cardano (ADA) is trading within a critical support range of $0.66 and $0.80, and traders are monitoring its performance amid market volatility. In the last 24 hours, ADA has declined by 2.65%, raising concerns about further drops.
Cardano
2025-03-11

Ethereum (ETH) Strategic Reserve, Binance Coin (BNB) Hard Fork, and BitLemons Seizing the Moment
The cryptocurrency market presents various opportunities, highlighting BitLemons ($BLEM) as it approaches the end of its presale, while Ethereum upgrades and Binance Coin prepares for a hard fork. BitLemons boasts a functioning Web3 gaming platform and commitment to value creation, making it an appealing option for early investors.
Cardano
2025-03-11
What's Next for Cardano Price as Whales Accumulate 180 Million ADA
Cardano (ADA) has seen significant whale accumulation, with investors acquiring over 180 million ADA tokens, indicating renewed institutional interest. This trend points towards potential price stabilization and growth for Cardano in the long run.
Cardano
2025-03-11