
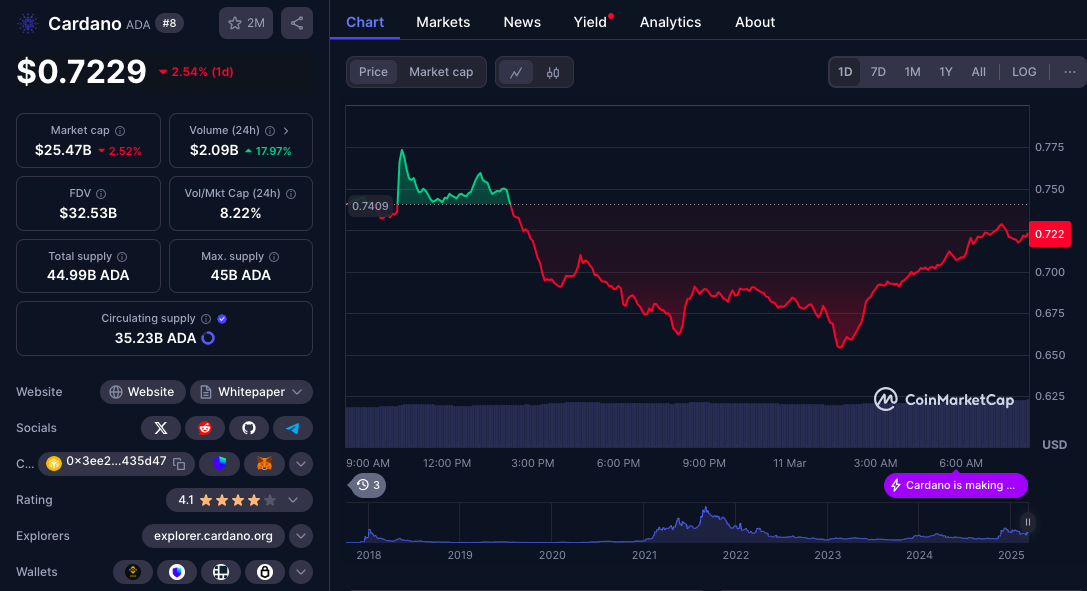
Technical Analysis of Cardano on March 11, 2025
The market experienced a bearish engulfing reversal on November 22, 2024, hinting at a potential uptrend; however, a significant decline occurred in early February 2025, showing strong bearish momentum. With resistance at 1.1632 and support at 0.6307, the short-term outlook appears bearish given recent trading volumes and technical indicators.
Article
The financial markets are often characterized by their volatility and the cyclical nature of price movements, leading traders to constantly seek out patterns and signals that can inform their next strategic moves. Recent developments in the market have highlighted particularly fascinating price action that could influence trading strategies in the near future. A noteworthy occurrence was on November 22, 2024, when the market showcased a bearish engulfing pattern — a well-known candlestick formation signaling a potential reversal. Initially, this bearish engulfing set the stage for what many traders anticipated would be a bullish uptrend. However, as the days unfolded, it became evident that the market’s trajectory was more complex. By early February 2025, the situation deteriorated dramatically, revealing a robust bearish momentum that led to a protracted decline in prices. There seemed to be a glimmer of hope for market bulls with a significant price surge on March 2, 2025. However, this rally appears to be more of a short-term respite than a sustainable uptrend, as key resistance points emerged around the price of approximately 1.1632. At the same time, a crucial support level around 0.6307 has been identified, setting the stage for potential price action to oscillate between these two levels in the foreseeable future. Trading volumes have offered further insights into market sentiment. Notably, on November 10, 2024, trading volumes escalated to an impressive 54.15 million units, illustrating heightened investor activity and interest during that period. This was followed closely by the second-highest trading volume recorded at 50.24 million units just shortly after the significant surge on March 2, 2025. Conversely, there was also a significant sell-off that took place on February 3, 2025, where trading volume dipped to 29.07 million units, further emphasizing the overall bearish sentiment prevailing in the market. In the realm of technical analysis, the signal of a ‘death cross’ forming among short-term moving averages has raised alarm bells among traders. This critical technical indicator occurs when a shorter-term moving average crosses below a longer-term moving average, traditionally signaling bearish momentum and a potential continuation of downward price trends. To further support this bearish outlook, the MACD (Moving Average Convergence Divergence) indicator also suggests that selling pressure is currently overwhelming bullish attempts in the market. Given these indicators, it is advisable for traders to be highly cautious and to keenly monitor ongoing developments for any reversal signals. Observing the dynamics around key support and resistance levels will be paramount in the decision-making process. Additionally, traders may want to adopt a more defensive posture, being aware that the market may remain on its downward trajectory in the near term. In conclusion, traders navigating the current market landscape should employ a combination of technical analysis and volume monitoring as part of their strategy. Understanding the implications of the bearish engulfing pattern, death cross, and MACD signals is essential. Keeping an eye on critical support and resistance levels will empower traders to make informed decisions during this period of heightened uncertainty, potentially positioning themselves for longer-term opportunities when the market sentiment shifts. As always, maintaining a disciplined approach to risk management will be valuable as the market continues to evolve.
Keywords
 Cardano
2025-03-11
Blockenza Analysis
Based on the current bearish trend and technical indicators, the market appears poised for further declines, warranting a negative score.
FAQs
1. What is a bearish engulfing reversal?
It is a candlestick pattern that indicates a potential change in trend from upward to downward.
2. When did the bearish engulfing reversal occur?
The pattern was identified on November 22, 2024 (UTC).
3. What does the recent decline indicate?
The decline, particularly noted in early February 2025, suggests strong bearish momentum.
4. What was the recent peak trading volume?
The highest trading volume reached was 54.15 million units on November 10 (UTC).
5. What are the key resistance and support levels?
Key resistance is at 1.1632 and support is at 0.6307.
6. What does a death cross indicate?
A death cross indicates a bearish trend, where short-term averages cross below long-term averages.
7. What is the significance of the MACD indicator?
The MACD indicator suggests that bearish forces are currently in control of the market.
8. What should traders watch for?
Traders should monitor the effectiveness of the support level and look for reversal signals in indicators.
9. What happened on February 3, 2025?
A significant sell-off occurred, with a trading volume of 29.07 million units.
10. What are the prospects for short-term price movement?
The outlook suggests a continued decline in the short term.
Related Articles
In this section, you will find articles and analyses related to this post. These materials will help you gain more information about the topic and develop a broader perspective on the digital currency market. By reading these articles, you can make more informed and precise decisions in your investment journey.

Cardano Faces Challenges at $0.80: Future Price Movement Depends on Bulls' Defense
Cardano (ADA) is at a critical support level of $0.80, and its future price movement depends on maintaining this range or risk falling deeper. Investors should remain vigilant as market dynamics will play a crucial role in shaping ADA's next steps.
Cardano
2025-03-11

The Magic Line: Key Support Level at $74,000 Determines Bitcoin's Bull or Bear Future
Bitcoin has recently faced a major correction, dropping 27.52% and currently hovering around the critical support level of $74,000, which is indicative of market sentiment and a historical buffer against bear markets. With fears of a recession and volatility impacting investor behavior, experts suggest a potential entry point for investors between $52,000 and $60,000 if BTC continues to decline.
Cardano
2025-03-11

Cardano: Is ADA Setting Up a Bear Trap Before a 2021-Style Breakout?
Cardano's ADA may be forming a classic bear trap that could lead to a breakout akin to its performance in 2021. Analysts are observing key price levels to determine the direction of ADA's future movements.
Cardano
2025-03-11
Cardano (ADA) Faces Key Resistance at $0.80—Will It Breakout or Drop Further?
Cardano (ADA) is trading within a critical support range of $0.66 and $0.80, and traders are monitoring its performance amid market volatility. In the last 24 hours, ADA has declined by 2.65%, raising concerns about further drops.
Cardano
2025-03-11

Ethereum (ETH) Strategic Reserve, Binance Coin (BNB) Hard Fork, and BitLemons Seizing the Moment
The cryptocurrency market presents various opportunities, highlighting BitLemons ($BLEM) as it approaches the end of its presale, while Ethereum upgrades and Binance Coin prepares for a hard fork. BitLemons boasts a functioning Web3 gaming platform and commitment to value creation, making it an appealing option for early investors.
Cardano
2025-03-11
What's Next for Cardano Price as Whales Accumulate 180 Million ADA
Cardano (ADA) has seen significant whale accumulation, with investors acquiring over 180 million ADA tokens, indicating renewed institutional interest. This trend points towards potential price stabilization and growth for Cardano in the long run.
Cardano
2025-03-11