
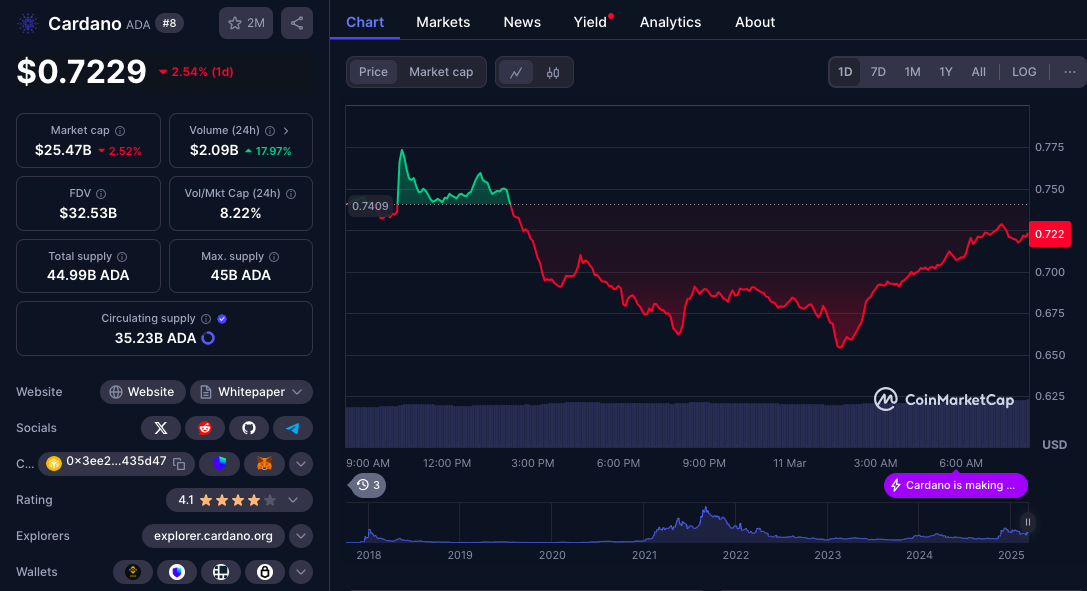
Technical Analysis of Cardano on March 3, 2025
The cryptocurrency has seen an uptrend, followed by fluctuations and a downtrend, but recent indicators suggest a possible rebound. Key resistance levels are at 0.8000 and 1.2400, while the support level stands at 0.6300.
Article
The landscape of cryptocurrency is a fickle one, often shaped by fluctuating trends and volatile price movements. One cryptocurrency, in particular, has demonstrated a pronounced trajectory divided into three key phases: an uptrend, a fluctuation, and a downtrend. By analyzing the historical price data and trading volumes, we can glean valuable insights into its potential future performance. The first phase, characterized by a significant uptrend, commenced in early November 2024 (UTC). During this period, the cryptocurrency saw remarkable price appreciation, likely driven by a surge in investor interest, favorable market sentiment, or major developments within the underlying technology or community. It is common in the cryptocurrency sphere for positive news or announcements to act as catalysts for price rallies, leading many traders to jump in and capitalize on the momentum. Following this period of growth, the market entered the second phase—a phase of fluctuation that persisted from mid-to-late November through to mid-December 2024 (UTC). This period was marked by price consolidation, wherein the cryptocurrency oscillated within a range, unable to decisively break through established support or resistance levels. This typically indicates uncertainty among traders, as market participants weigh the potential for future price movements against the backdrop of recent changes in market sentiment and external factors. As we transitioned into the third phase, a downtrend emerged from mid-to-late December 2024 (UTC) through early February 2025 (UTC). This downturn could be attributed to various factors, such as regulatory headwinds, macroeconomic conditions affecting the broader market, or profit-taking behaviors from investors who previously capitalized on the earlier uptrend. The decline reached a critical juncture in early February, where prices experienced a drastic drop, signaling a bearish sentiment among the trading community. However, just as despair can often set in, early March 2025 (UTC) painted a different picture, showcasing a significant bullish candle on the charts. This could very well signal a prospective rebirth of bullish momentum—a hopeful indication for traders eager to reengage with the asset. The journey of this cryptocurrency exemplifies the volatility inherent in digital assets, where a single day can dramatically alter perceptions of market potential. When analyzing the price levels, it's noteworthy that the critical resistance level stands at approximately 0.8000. Also looming overhead is the previous high of around 1.2400, which presents a formidable challenge for upward price movement. On the other hand, the key support level sits at approximately 0.6300, which may provide a safety net in case prices decline further. Trading volume is another crucial indicator to observe, as it reflects how engaged the market is with the asset. On November 10, 2024 (UTC), trading volume peaked at a staggering 54.15 million units, correlating with the price surge experienced at that time. A similar spike occurred on March 2, 2025 (UTC), with 50.24 million units traded, reinforcing the notion of an impending rebound. High trading volumes, particularly alongside price increases, often herald an uptick in buyer interest, suggesting that the market may be gearing up for a significant rally. Lastly, the Moving Average Convergence Divergence (MACD) indicator is painting a picture of potential short-term rebound signals. Still, traders are urged to approach with caution, as the long-term trend remains somewhat ambiguous. This uncertainty emphasizes the importance of monitoring future price movements and market conditions to ascertain whether resistance levels can be effectively breached. In conclusion, while the past few months have posed challenges for this cryptocurrency, the indicators point towards possible opportunities for discerning investors. As always in the ever-changing world of cryptocurrencies, vigilance and informed decision-making remain paramount in navigating the tides of market sentiment.
Keywords
 Cardano
2025-03-03
Blockenza Analysis
Given the recent bullish signs and increasing trading volumes, there is a moderate expectation for a price rebound in the short term.
FAQs
1. What phases has the cryptocurrency experienced?
It experienced an uptrend, fluctuation, and a downtrend.
2. When did the cryptocurrency experience an uptrend?
The uptrend occurred in early November 2024.
3. What were the key resistance levels identified?
The key resistance levels are around 0.8000 and the previous high at 1.2400.
4. What is the key support level for this cryptocurrency?
The key support level is around 0.6300.
5. What trading volume was recorded on November 10, 2024?
The trading volume reached 54.15 million units.
6. What does the MACD indicator suggest?
The MACD indicator shows short-term rebound signs.
7. What does the bullish candle in early March indicate?
It suggests a potential rebound for the cryptocurrency.
8. What was the trading volume on March 2, 2025?
The trading volume reached 50.24 million units.
9. What timeframe is proposed for monitoring the resistance?
It is necessary to monitor the resistance in the coming periods.
10. What key event occurred in early February 2025?
A cliff-like drop was experienced in early February 2025.
Related Articles
In this section, you will find articles and analyses related to this post. These materials will help you gain more information about the topic and develop a broader perspective on the digital currency market. By reading these articles, you can make more informed and precise decisions in your investment journey.

Cardano Faces Challenges at $0.80: Future Price Movement Depends on Bulls' Defense
Cardano (ADA) is at a critical support level of $0.80, and its future price movement depends on maintaining this range or risk falling deeper. Investors should remain vigilant as market dynamics will play a crucial role in shaping ADA's next steps.
Cardano
2025-03-11

The Magic Line: Key Support Level at $74,000 Determines Bitcoin's Bull or Bear Future
Bitcoin has recently faced a major correction, dropping 27.52% and currently hovering around the critical support level of $74,000, which is indicative of market sentiment and a historical buffer against bear markets. With fears of a recession and volatility impacting investor behavior, experts suggest a potential entry point for investors between $52,000 and $60,000 if BTC continues to decline.
Cardano
2025-03-11

Cardano: Is ADA Setting Up a Bear Trap Before a 2021-Style Breakout?
Cardano's ADA may be forming a classic bear trap that could lead to a breakout akin to its performance in 2021. Analysts are observing key price levels to determine the direction of ADA's future movements.
Cardano
2025-03-11
Cardano (ADA) Faces Key Resistance at $0.80—Will It Breakout or Drop Further?
Cardano (ADA) is trading within a critical support range of $0.66 and $0.80, and traders are monitoring its performance amid market volatility. In the last 24 hours, ADA has declined by 2.65%, raising concerns about further drops.
Cardano
2025-03-11
Ethereum (ETH) Strategic Reserve, Binance Coin (BNB) Hard Fork, and BitLemons Seizing the Moment
The cryptocurrency market presents various opportunities, highlighting BitLemons ($BLEM) as it approaches the end of its presale, while Ethereum upgrades and Binance Coin prepares for a hard fork. BitLemons boasts a functioning Web3 gaming platform and commitment to value creation, making it an appealing option for early investors.
Cardano
2025-03-11
What's Next for Cardano Price as Whales Accumulate 180 Million ADA
Cardano (ADA) has seen significant whale accumulation, with investors acquiring over 180 million ADA tokens, indicating renewed institutional interest. This trend points towards potential price stabilization and growth for Cardano in the long run.
Cardano
2025-03-11