
Technical Analysis of Cardano on March 6, 2025
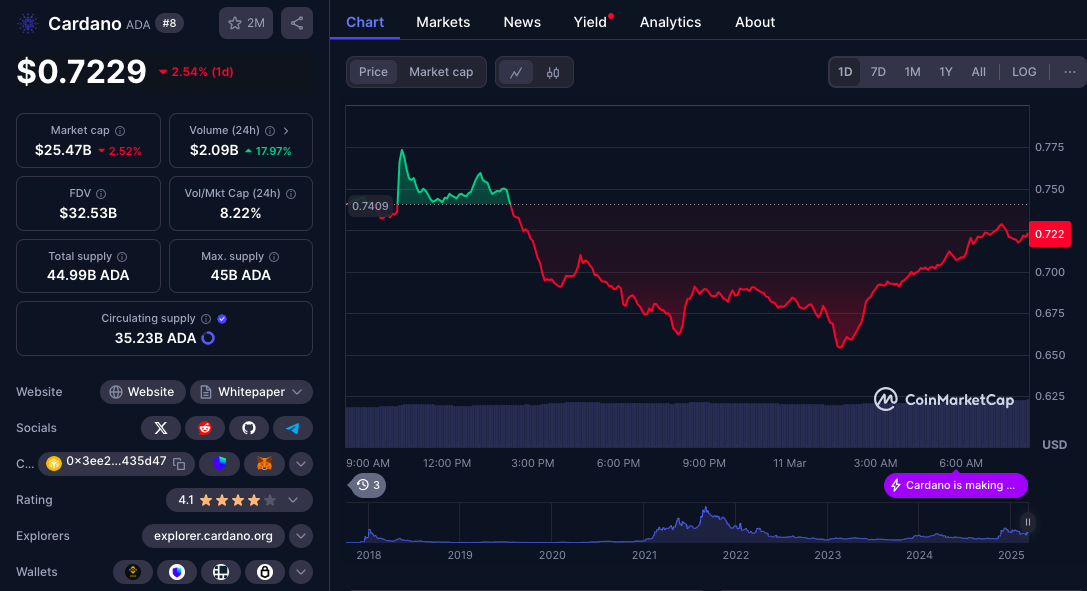
Technical analysis indicates a potential short-term rebound in early March 2025 after a significant plunge in February 2025, though overall trends remain bearish. Key support and resistance levels have been identified at 0.63 and 1.15 respectively, while trading volumes indicate possible turning points.
Article
Technical analysis is a crucial aspect of financial market trading, and professionals continually evaluate trends, volume, and indicators to forecast future movements. The cryptocurrency market, as well as traditional markets, often showcase patterns that can either indicate bullish or bearish trends. In this piece, we will delve deeper into the current analysis of trends, resistance, and support levels witnessed in early November 2024 and early February 2025, providing a comprehensive view of what traders might expect moving forward. In early November 2024 (UTC), a noticeable upward trend was observed, suggesting a period of potential growth and increased investor confidence. However, the long upper shadow formed on November 22 (UTC) serves as a cautionary signal of resistance. This indicates that although prices may have surged, sellers stepped in at higher levels, preventing further upward movement. Such patterns are critical as they can inform traders about potential reversals or continued bearish pressure. The market experienced a dramatic cliff-like plunge in early February 2025 (UTC), which can be alarming for investors. Nevertheless, the emergence of a significant bullish candle in early March 2025 (UTC) might indicate a possible rebound, signaling that buyers are attempting to regain momentum and push the prices back up. This turnaround could be key for traders looking to capitalize on price fluctuations, but it is essential to approach it with an understanding of market dynamics. In terms of support and resistance levels, preliminary support sits at approximately 0.63, with a stronger support level identified at 0.5177. This means that should prices begin to decline, these levels might act as safety nets, preventing further loss. Conversely, the preliminary resistance level is around 1.15, while a stronger resistance level exists at 1.3262. Traders typically keep a close watch on these levels, as they are pivotal points where buying sentiments may overturn selling pressures, leading to price consolidations or reversals. Trading volume, another critical element of technical analysis, peaked at 54.15 million units on November 10 (UTC) and surged to 50.24 million units on March 2, 2025 (UTC). Such high trading volumes often indicate heightened interest and can serve as confirmation of significant price movements. A surge in trading volume, especially in conjunction with a bullish candlestick pattern, can signify that the market is about to embark on a bullish trend, signaling potential entry points for buyers. The Moving Average Convergence Divergence (MACD) indicator is another analytical tool used to gauge momentum. The current values reflect a DIF value of 0.0215, indicating a bullish crossover, while the DEA value sits at -0.0138. The histogram value at 0.0354 suggests that momentum may be shifting and reinforces the idea of a possible rebound. However, it is important to note that despite these signs, the overall trend appears to be bearish, advising traders to proceed cautiously. In conclusion, while there are indicators pointing toward a possible short-term rebound, the broader context remains essential to consider. The combination of resistance levels, support zones, and volume trends form a complex tapestry that traders must navigate. Therefore, although a reversal could be on the horizon, remaining vigilant and prepared for fluctuations is crucial in achieving success in the ever-changing trading landscape. As the market evolves, continued observation of these indicators will be invaluable in making informed trading decisions.
Keywords
 Cardano
2025-03-06
Blockenza Analysis
The analysis suggests a potential short-term rebound and stabilization after a bearish trend, indicated by trading volumes and MACD indicators. However, the overall trend remains cautious, thus a score of 30 reflects a slight bullish sentiment.
FAQs
1. What trend was observed in early November 2024?
An upward trend was observed.
2. What does the long upper shadow on November 22 indicate?
It suggests resistance.
3. What happened in early February 2025?
There was a significant plunge.
4. What does the bullish candle in early March indicate?
It may signal a rebound.
5. What are the preliminary support and resistance levels?
Preliminary support is around 0.63 and resistance is around 1.15.
6. What was the trading volume peak on November 10?
The trading volume peaked at 54.15 million units.
7. What does the MACD indicator suggest?
It may suggest a rebound.
8. Is the overall trend bullish or bearish?
The overall trend is bearish.
9. What is advised despite the potential rebound?
Caution is advised.
10. What was the trading volume on March 2, 2025?
The trading volume surged to 50.24 million units.
Related Articles
In this section, you will find articles and analyses related to this post. These materials will help you gain more information about the topic and develop a broader perspective on the digital currency market. By reading these articles, you can make more informed and precise decisions in your investment journey.

Cardano Faces Challenges at $0.80: Future Price Movement Depends on Bulls' Defense
Cardano (ADA) is at a critical support level of $0.80, and its future price movement depends on maintaining this range or risk falling deeper. Investors should remain vigilant as market dynamics will play a crucial role in shaping ADA's next steps.
Cardano
2025-03-11

The Magic Line: Key Support Level at $74,000 Determines Bitcoin's Bull or Bear Future
Bitcoin has recently faced a major correction, dropping 27.52% and currently hovering around the critical support level of $74,000, which is indicative of market sentiment and a historical buffer against bear markets. With fears of a recession and volatility impacting investor behavior, experts suggest a potential entry point for investors between $52,000 and $60,000 if BTC continues to decline.
Cardano
2025-03-11

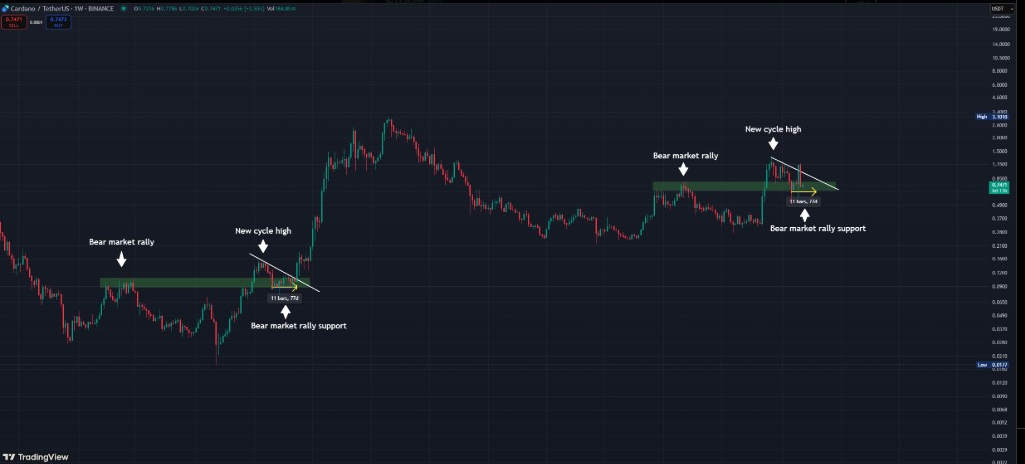
Cardano: Is ADA Setting Up a Bear Trap Before a 2021-Style Breakout?
Cardano's ADA may be forming a classic bear trap that could lead to a breakout akin to its performance in 2021. Analysts are observing key price levels to determine the direction of ADA's future movements.
Cardano
2025-03-11
Cardano (ADA) Faces Key Resistance at $0.80—Will It Breakout or Drop Further?
Cardano (ADA) is trading within a critical support range of $0.66 and $0.80, and traders are monitoring its performance amid market volatility. In the last 24 hours, ADA has declined by 2.65%, raising concerns about further drops.
Cardano
2025-03-11

Ethereum (ETH) Strategic Reserve, Binance Coin (BNB) Hard Fork, and BitLemons Seizing the Moment
The cryptocurrency market presents various opportunities, highlighting BitLemons ($BLEM) as it approaches the end of its presale, while Ethereum upgrades and Binance Coin prepares for a hard fork. BitLemons boasts a functioning Web3 gaming platform and commitment to value creation, making it an appealing option for early investors.
Cardano
2025-03-11
What's Next for Cardano Price as Whales Accumulate 180 Million ADA
Cardano (ADA) has seen significant whale accumulation, with investors acquiring over 180 million ADA tokens, indicating renewed institutional interest. This trend points towards potential price stabilization and growth for Cardano in the long run.
Cardano
2025-03-11