
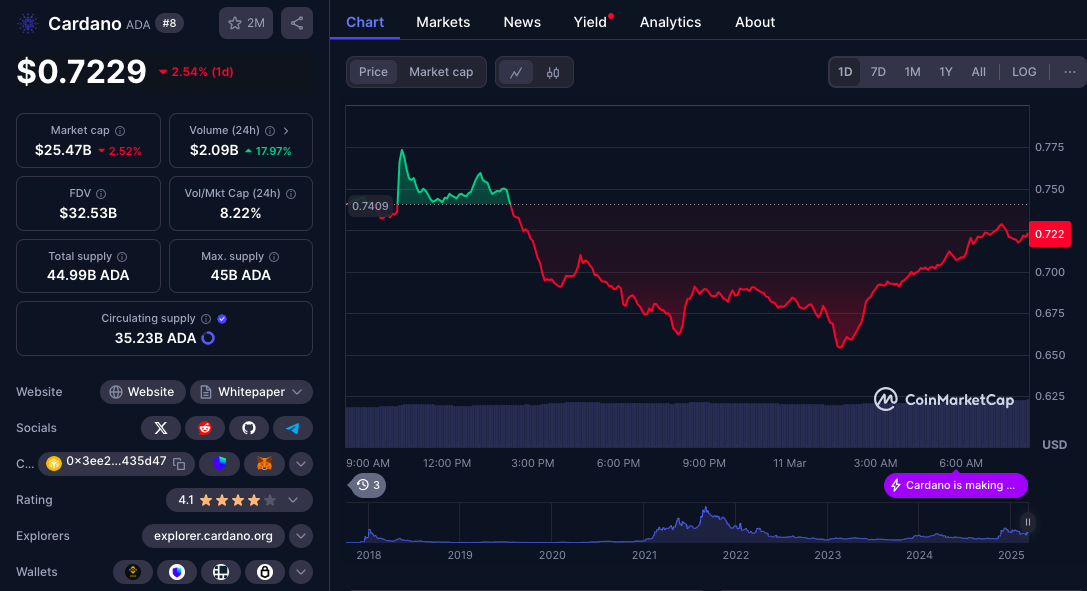
Technical Analysis of Cardano on March 7, 2025
This cryptocurrency saw significant price volatility with a rise from October to mid-November 2024, but after a sharp drop in early 2025, it showed signs of consolidation. Recent indicators suggest a cooling off in bullish momentum, prompting attention to key support and resistance levels.
Article
The world of cryptocurrency often mirrors the unpredictability of financial markets, with trends that can shift dramatically in short periods. In the case of the cryptocurrency in question, it is important to understand its recent price movements in detail, as they provide essential insights into potential future performance and investment strategies. From October to mid-November 2024, the cryptocurrency experienced a remarkably volatile upward trend. This period was characterized by an influx of bullish sentiment among investors, which propelled prices to new heights. The excitement surrounding the technology underpinning cryptocurrencies, the increasing adoption of digital assets, and the general enthusiasm within the crypto community likely fueled this surge in value. However, as with all things in the cryptocurrency market, volatility is the norm, and such upward movements are often followed by corrections or downward retracements. On November 22nd, 2024, the upward trajectory was marked by a long upper wick on the daily price chart, which typically signifies that prices reached a certain high but were unable to sustain those levels as selling pressure ensued. This wick indicates that while investors were initially willing to push prices up, market forces quickly reversed their sentiment. Subsequently, the cryptocurrency faced a dramatic decline between late January and early February 2025, reminiscent of a cliff-like plunge—a sharp trending downward that could unsettle investors who were not prepared for the volatility. After reaching a low point and consolidating, the cryptocurrency began to show signs of recovery in early March. A significant bullish candle emerged on March 2, 2025, resulting in a price surge that illustrated renewed investor confidence. However, it is essential to note that while this surge was impressive, the bullish momentum began to wane shortly after, indicating potential fatigue among buyers. With the cryptocurrency seeing trading volumes of 50.24 million units on March 2 (UTC), there appeared to be a strong interest in the asset, even as trading volume indicated signs of weakening once prices began to stabilize. Analyzing the price action further, two critical levels emerge: a resistance level around 1.1500—established by the high on March 2, 2025—and a support level at approximately 0.8000. These levels are crucial for traders and investors, as they represent the boundaries within which price movements are likely to oscillate in the short term. Given the delicate balance between support and resistance, attention to these levels could provide insights into potential breakouts or breakdowns. Furthermore, technical indicators can lend clarity to this analysis. The Moving Average Convergence Divergence (MACD) indicator has recently crossed over, with the Differential (DIF) value at 0.026 and the Signal (DEA) value at -0.0058, which raises caution among traders. The histogram value at 0.0319 suggests that while there may still be some bullish momentum present, it is weakening and might soon signal a reversal. Consequently, the potential for a pullback must be closely observed. In conclusion, those involved in cryptocurrency trading need to remain vigilant in monitoring market dynamics, especially in light of recent price action. As this cryptocurrency may face corrective pressures in the near term, awareness of key support and resistance levels, alongside technical indicators like MACD, will be pivotal for making informed investment decisions. The cryptocurrency market is undeniably thrilling but equally risky, necessitating sound strategies and continual market analysis to navigate effectively.
Keywords
 Cardano
2025-03-07
Blockenza Analysis
The current indicators show weakening bullish momentum, suggesting that short-term corrections may lead to further price decline.
FAQs
1. What trend did the cryptocurrency follow from October to mid-November 2024?
It experienced a volatile upward trend.
2. What happened on November 22, 2024?
A long upper wick appeared during the price action.
3. When did the cryptocurrency experience a significant drop?
In late January to early February 2025.
4. What was the key resistance level identified?
Around 1.1500.
5. What indicates a weakening upward momentum?
A decline in trading volume.
6. What did the MACD indicator show?
It indicated that the bullish force is fading.
7. What are the support and resistance levels to watch?
Support is around 0.8000, and resistance is around 1.1500.
8. What value did the trading volume reach on March 2, 2025?
50.24 million units.
9. What should traders monitor in the short term?
Potential corrections and breakouts at support and resistance levels.
10. What suggests a risk of pullback?
The crossover of the MACD and declining bullish momentum.
Related Articles
In this section, you will find articles and analyses related to this post. These materials will help you gain more information about the topic and develop a broader perspective on the digital currency market. By reading these articles, you can make more informed and precise decisions in your investment journey.

Cardano Faces Challenges at $0.80: Future Price Movement Depends on Bulls' Defense
Cardano (ADA) is at a critical support level of $0.80, and its future price movement depends on maintaining this range or risk falling deeper. Investors should remain vigilant as market dynamics will play a crucial role in shaping ADA's next steps.
Cardano
2025-03-11

The Magic Line: Key Support Level at $74,000 Determines Bitcoin's Bull or Bear Future
Bitcoin has recently faced a major correction, dropping 27.52% and currently hovering around the critical support level of $74,000, which is indicative of market sentiment and a historical buffer against bear markets. With fears of a recession and volatility impacting investor behavior, experts suggest a potential entry point for investors between $52,000 and $60,000 if BTC continues to decline.
Cardano
2025-03-11

Cardano: Is ADA Setting Up a Bear Trap Before a 2021-Style Breakout?
Cardano's ADA may be forming a classic bear trap that could lead to a breakout akin to its performance in 2021. Analysts are observing key price levels to determine the direction of ADA's future movements.
Cardano
2025-03-11
Cardano (ADA) Faces Key Resistance at $0.80—Will It Breakout or Drop Further?
Cardano (ADA) is trading within a critical support range of $0.66 and $0.80, and traders are monitoring its performance amid market volatility. In the last 24 hours, ADA has declined by 2.65%, raising concerns about further drops.
Cardano
2025-03-11

Ethereum (ETH) Strategic Reserve, Binance Coin (BNB) Hard Fork, and BitLemons Seizing the Moment
The cryptocurrency market presents various opportunities, highlighting BitLemons ($BLEM) as it approaches the end of its presale, while Ethereum upgrades and Binance Coin prepares for a hard fork. BitLemons boasts a functioning Web3 gaming platform and commitment to value creation, making it an appealing option for early investors.
Cardano
2025-03-11
What's Next for Cardano Price as Whales Accumulate 180 Million ADA
Cardano (ADA) has seen significant whale accumulation, with investors acquiring over 180 million ADA tokens, indicating renewed institutional interest. This trend points towards potential price stabilization and growth for Cardano in the long run.
Cardano
2025-03-11