
Technical Analysis of Cryptocurrency on March 10, 2025
This cryptocurrency experienced a brief rise in mid-November 2024 before undergoing a correction and subsequent downward trend into early March 2025. Currently, there are no significant reversal signs, with key resistance at 0.45 and support at 0.27.
Article
In mid-November 2024, the cryptocurrency market experienced a notable surge that caught the attention of traders and investors alike. This brief upward trend gave rise to a sense of optimism; however, it quickly transitioned into a correction phase that has since raised concerns about the asset's overall health and future performance. As we delve into the dynamics of this cryptocurrency, an analysis of its price pattern reveals crucial insights into the market's current state and its trajectory heading into 2025. Initially, the rebound early in 2025 failed to generate the substantial momentum required to break free from the prevailing downward trend that has characterized this asset since February. This downward movement has been consistent, with the cryptocurrency trading at progressively lower levels, showcasing minimal signs of a robust reversal. For traders aiming to identify potential entry points, observing the established key resistance and support levels becomes imperative. Currently, the notable resistance level hovers around 0.45, which will be a formidable barrier for any attempted recovery. On the other hand, the support level stands at approximately 0.27, acting as a critical threshold that, if breached, could lead to further declines. Furthermore, the trading volume during this period paints a stark picture of the asset's declining interest. Despite an impressive surge that peaked at 34.16 million units in mid-November, trading volume has since diminished substantially. This drop in volume often signals a waning interest from traders and investors, reinforcing the idea that the current trend lacks the strength that was initially observed. Consistent patterns in low volume could indicate a market that is consolidating, but the lack of a significant catalyst could prolong this state of stagnation. Looking at technical indicators, the short-term moving average being situated below the long-term moving average suggests a bearish setup that is important for traders to note. This configuration signifies that recent price movements are trending downwards, and unless a clear change in sentiment occurs, the path of least resistance may remain to the downside. Additionally, the Moving Average Convergence Divergence (MACD) indicator reflects weak oscillations within the market, further corroborating the overarching bearish sentiment and lack of momentum necessary for a strong bullish reversal. As for predictions regarding future price movements, it is anticipated that in the short term, the cryptocurrency could either slide to lower levels or continue oscillating within its current range. Traders should remain vigilant and watch for any developments that could signal a change in sentiment, such as significant news, technological advancements, or macroeconomic factors that might inspire renewed interest in the asset. In conclusion, the mid-November rally in 2024 was a fleeting glimpse of optimism, now overshadowed by a steady decline characterized by low trading volumes and bearish indicators. As 2025 unfolds, the emphasis will shift to closely monitoring the resistance and support levels alongside broader market trends to gain insights into the cryptocurrency’s potential future trajectory. Engaging in diligent research and analysis will be key for market participants attempting to navigate these uncertain waters.
Keywords
 Stellar
2025-03-10
Blockenza Analysis
The overall analysis indicates a bearish outlook for the cryptocurrency, with declining trends, low trading volumes, and a negative arrangement of moving averages suggesting continued downward price movement.
FAQs
1. When did the cryptocurrency experience an upward trend?
In mid-November 2024.
2. What happened after the brief upward trend?
It entered a correction period.
3. What was the trading volume in mid-November?
34.16 million units.
4. What are the key resistance and support levels?
Resistance is around 0.45, support is around 0.27.
5. What does the short-term moving average indicate?
It is running below the long-term moving average, forming a bearish arrangement.
6. Is there any significant reversal signal currently?
No, there are no significant reversal signals.
7. What does the MACD indicator show?
It shows a weak oscillation in the market.
8. What is the expected price behavior in the short-term?
The price may explore lower levels or maintain fluctuations.
9. What trend has been observed from February to early March 2025?
A consistent downward trend.
10. How has trading volume changed since mid-November?
The trading volume has shrunk significantly and remains low.
Related Articles
In this section, you will find articles and analyses related to this post. These materials will help you gain more information about the topic and develop a broader perspective on the digital currency market. By reading these articles, you can make more informed and precise decisions in your investment journey.
Technical Analysis of Cryptocurrency as of March 11, 2025
The cryptocurrency showed an upward trend in late November 2024 but could not maintain its momentum, facing significant selling pressure. After further declines and a critical breach of support levels, market indicators suggest a continued bearish outlook.
Stellar
2025-03-11
This Token is Predicted to Explode and Reach $1 Faster Than Stellar (XLM), Dogecoin (DOGE), and Polygon (POL)
BinoFi (BINO) is a new cryptocurrency that is gaining attention for its advanced technology and market momentum, with potential to hit the $1 milestone faster than established tokens like Stellar, Dogecoin, and Polygon. Its innovative features and growing investor interest suggest it could become a significant player in the digital asset space.
Stellar
2025-03-11

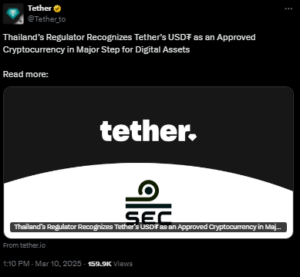
Thailand SEC Approves Tether (USDT) and Circle (USDC) as Trading Pairs
Thailand's SEC has approved Tether (USDT) and Circle (USDC) as trading pairs on regulated digital asset exchanges, following strong public support. This decision marks a significant evolution in the country's cryptocurrency landscape.
Stellar
2025-03-11
Thailand Approves USDT and USDC for Cryptocurrency Trading
Thailand's SEC has approved Tether's USDt and Circle's USDC for trading on regulated exchanges, aiming to embrace digital assets while ensuring regulatory compliance. This approval could potentially enhance the crypto trading landscape within the country.
Stellar
2025-03-11

Fundamental Analysis of Cryptocurrency on 11-03-2025
The cryptocurrency market saw a significant surge in mid-November 2024, followed by a notable downtrend as bearish sentiment prevailed through early 2025. Key resistance and support levels were identified, and technical indicators pointed towards a continued bearish outlook amidst diminishing trading volumes.
Stellar
2025-03-11

Tired Of Crypto Losses? Follow Smart Dogecoin Wallets Who Have Piled Millions Into This 10000x Altcoin
The meme coin sector is currently declining due to issues surrounding Trump's Bitcoin reserve strategy, impacting Dogecoin. Meanwhile, a new DeFi project, Remittix, is gaining traction among traders for its unique use case and promising ROI.
Stellar
2025-03-11