
Technical Analysis of Solana as of March 5, 2025
The market experienced volatile upward movement until mid-November 2024, followed by a downward trend confirmed in February 2025, culminating in a sharp decline on February 24. Key resistance levels are noted at 270.00 and 295.00, with critical support below 130.60 and 125.62, indicating the potential for further downward movement if breached.
Article
The financial markets are inherently unpredictable, often characterized by periods of volatility and shifting trends. As we analyze the market movements from early October to mid-November 2024, we can observe a significant upward trajectory that appeared promising at first glance. However, this upward momentum began to wane as we approached mid-January 2025, culminating in bearish signals that suggested a possible downturn. During the initial phase of this market uptrend, various factors contributed to investor optimism. The overall economic environment, alongside specific financial sector developments, spurred heightened investor enthusiasm, leading to a notable rally. However, as the year turned and January progressed, some indicators hinted at a weakening trend. Key among these indicators were short-term moving averages and the Moving Average Convergence Divergence (MACD) – both of which disclosed a downward trend that forewarned investors of potential turbulence ahead. As February 2025 arrived, the bearish trend became more pronounced, with the critical date of February 24 marking a dramatic decline. This steep drop was characterized by a "cliff-like" plunge, immediately catching the attention of traders and investors alike. The significant increase in trading volume accompanied by heightened selling pressure indicated that investors were reacting swiftly to the market's downward shift, likely out of fear of further losses. This selling frenzy underscored the fragility of the market and the psychological impact of bearish signals. Interestingly, earlier in January, particularly on the 18th and 19th, the market experienced substantial trading volumes and noteworthy gains. This short-lived uptick fueled speculation around a potential continuation of the bullish trend. Many investors pondered whether these movements indicated a still-vibrant market capable of sustaining upward momentum. However, the subsequent decline proved that appearances can be deceiving – what seemed like a possible resurgence morphed into a warning sign of an impending reversal. As we dissect the current state of the market, it's essential to identify key resistance and support levels that will be pivotal in the weeks ahead. Resistance levels situated at 270.00 and 295.00 (UTC) signify price points at which selling pressure typically escalates, indicating barriers to further price increases. Conversely, critical support levels established at 130.60 and 125.62 (UTC) represent the thresholds below which prices could fall dramatically. A breach beneath these support barriers could cascade into a more significant downturn, potentially instigating panic selling and exacerbating declines. Drawing insights from this period, several lessons emerge for both novice and experienced investors. The volatility observed during this timeframe highlights the importance of remaining vigilant and responsive to market indicators. Traders must exercise caution, considering both immediate signals and broader market trends when making decisions about buying or selling assets. In conclusion, as we move forward into 2025, the financial landscape remains uncertain, and investors should remain acutely aware of the market dynamics at play. Understanding the interplay of resistance and support levels is crucial in navigating potential risks and opportunities effectively. The ability to identify and react to market signals could prove vital in safeguarding investments and positioning oneself for potential gains in an unpredictable market.
Keywords
 Solana
2025-03-05
Blockenza Analysis
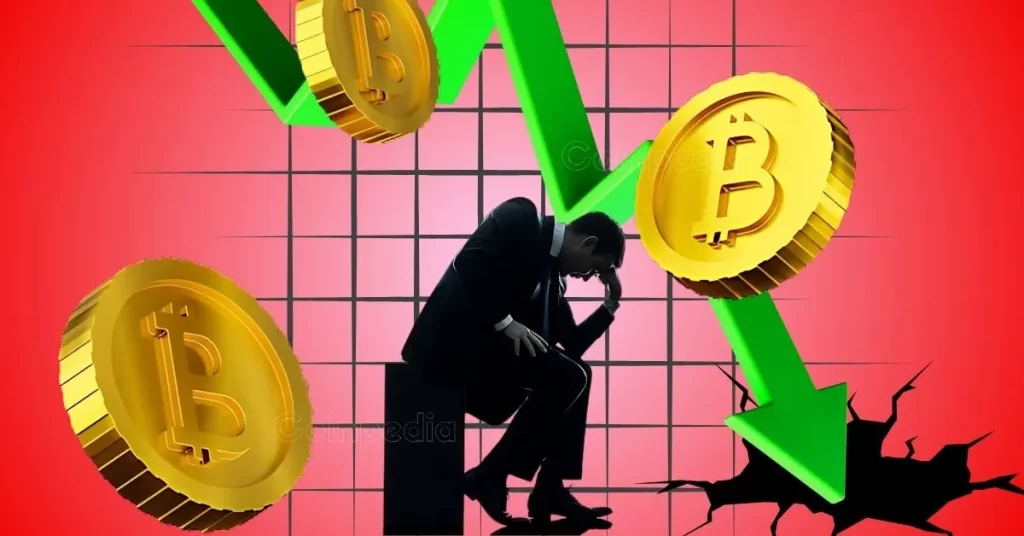
The analysis indicates a significant bearish sentiment, with indicators suggesting further downward movement likely.
FAQs
1. What was the market trend from October to November 2024?
The market exhibited a volatile upward trend during that period.
2. When did bearish signals start to emerge?
Bearish signals emerged in mid-January 2025.
3. What happened on February 24, 2025?
On February 24, there was a cliff-like plunge in the market with increased trading volume.
4. What were the key resistance levels identified?
The key resistance levels were at 270.00 and 295.00 (UTC).
5. What are the critical support levels?
The critical support levels are at 130.60 and 125.62 (UTC).
6. What indicated a trend reversal in January 2025?
A sharp decline following large trading volumes and significant gains indicated a potential trend reversal.
7. What does it mean if the price breaks below key support levels?
If the price breaks below the key support levels, it may trigger a more substantial downward move.
8. Was there any significant trading activity in January 2025?
Yes, January 18 and January 19 saw large trading volumes coupled with significant gains.
9. What indicators were used to assess the market trend?
The short-term moving averages and MACD indicator were used to assess the market trend.
10. What does the current market trend suggest?
The current trend suggests a bearish outlook given the recent price movements.
Related Articles
In this section, you will find articles and analyses related to this post. These materials will help you gain more information about the topic and develop a broader perspective on the digital currency market. By reading these articles, you can make more informed and precise decisions in your investment journey.
Crypto Prices Today, March 11: FTX Crypto, Pi Network News, Crypto Market Crash
On March 11, 2025, the crypto market faced a decline, with Bitcoin dropping to around $80,000 and Ethereum falling 10% below $2,000. This led to nearly a 4% market cap decrease to $2.58 trillion, resulting in a grim market sentiment.
Solana
2025-03-11
Solana (SOL) Insider Says This SOL Rival Could Lead The Altcoin Run Of 2025
Solana is a leading blockchain platform, trading near $137 due to its efficient operations and scalability. Leaders acknowledge that future competitors may challenge established giants, as evidenced by developments like Mutuum Finance's recent presale.
Solana
2025-03-11

Bitcoin and Ethereum Decline as Recession Fears Impact Traders
The cryptocurrency market, particularly Bitcoin and Ethereum, is facing significant declines due to growing macroeconomic concerns resulting in heightened investor anxiety. In the past 24 hours, Bitcoin fell by 2.2% and Ethereum by 10%, leading to substantial trading losses amidst recession fears.
Solana
2025-03-11

Fundamental Analysis of Solana on March 11, 2025
The cryptocurrency market is witnessing significant growth with Bitcoin and Ethereum leading the charge, while a new contender, Qubetics, aims to simplify multi-chain asset management through a non-custodial wallet. Despite the prevailing bullish sentiment, technical indicators suggest a cautious approach due to recent market volatility and potential bearish trends.
Solana
2025-03-11
Top VC Heavyweights Back $28 Million Endorsement: All You Need to Know About the New Project Double Zero by a Former Solana Foundation Core Member
The market is experiencing extreme fear, urging investors to remain calm and seek projects with alpha potential. Exploring these opportunities can lead to successful outcomes even during uncertain times.
Solana
2025-03-11
Key Concepts for Successful On-Chain Transactions
On-chain transactions' success relies heavily on understanding key concepts like block confirmations and transaction fees. Knowledge of these principles is crucial for executing efficient and reliable transactions on the blockchain.
Solana
2025-03-11