
Fundamental Analysis of Ethereum as of March 7, 2025
From early October 2024 to early March 2025, significant volatility in the financial markets led to a pronounced bearish trend, exacerbated by panic selling and investor anxiety regarding the global economic outlook. Market participants are advised to adopt cautious strategies and remain aware of key support and resistance levels, as signs of recovery hinge on stabilization and renewed investor confidence.
Article
The financial markets are notoriously volatile, a characteristic that investors and analysts alike have grappled with throughout the years. The period from early October 2024 to early March 2025 serves as a vivid example of this phenomenon, marked by a distinct downward trajectory across major indices and stocks. During this timeframe, the market's instability was palpable, with a broad bearish sentiment casting a shadow over trading behaviors and decision processes. At the beginning of this critical period, apprehensions regarding the global economic outlook began to take center stage among investors. As fears mounted, a gradual decline in market prices ensued, culminating in a pronounced downturn. Interestingly, a brief upswing in mid-November created a flicker of optimism, yet this moment was short-lived, failing to divert the overall negative trend shaping the market. This incident sends a critical message: short-lived rebounds should not be confused with enduring market recovery. A prevailing bearish sentiment persisted, serving as a cautionary tale for investors as they carefully reconsidered their strategies. The situation worsened as the calendar transitioned into early 2025, particularly around February 2 and 3, when a significant spike in trading volumes highlighted a growing wave of panic selling. Traders, gripped by fear due to a flurry of adverse market news and economic reports, hastily chose to unload their positions. This sell-off, indicative of a broader trend towards declining confidence in financial markets, further exacerbated the downward pressure on stock prices. It also underscored a critical moment for investors to reassess their positions and adopt more careful risk management measures. In addition to these macroeconomic events, technical analysis has reinforced the bearish trend, with relevant indicators suggesting a sustained downward trajectory. With support levels hovering around 2100 and resistance formations near 3450, traders are increasingly cognizant of psychological thresholds. As these levels reflect crucial points for potential market movements, they emphasize the necessity for investors to remain informed about market conditions. As the months progressed, it became evident that adverse economic indicators had a tangible impact, fueling market participants' need for reevaluation. Amid such unpredictability, a cautious approach became more crucial than ever. Investors are encouraged to implement robust risk management strategies, such as setting stop-loss orders, diversifying portfolios, and actively monitoring economic trends that may impact market sentiment. Looking ahead to early March 2025, a potential market rebound is conceivable—contingent upon the stabilization of valuations and the restoration of investor confidence. However, such a possibility serves as a reminder of the importance of vigilance in the face of unforeseen fluctuations. For long-term investors aiming to capitalize on these conditions, the focus should be on awareness, adaptability, and strategic foresight. In conclusion, the unpredictable nature of financial markets requires that investors remain continually alert, prepared to respond adeptly to changes. By developing a keen understanding of market dynamics and leveraging analytical tools, savvy investors can tactfully navigate the challenges that arise in volatile environments. The future remains unwritten, yet amid this uncertainty lies the potential for opportunity for those brave enough to act. The period from early October to mid-November 2024 showcased a dynamic and often volatile price movement, revealing both bullish and bearish sentiments. During this timeframe, heightened trading volumes indicated increased investor interest, peaked sharply with volumes of 12,500 units on November 6, 2024. The rapid rise in investor engagement during this bullish phase hinted at confidence in the asset's upward trajectory. However, profit-taking and emerging sellers soon led to fluctuations, stabilizing at elevated levels before giving way to a corrective phase. From early January to mid-February 2025, selling pressures intensified, and sharp downward movements raised concerns for traders who entered positions based on former highs without securing appropriate risk controls. Consequently, monitoring resistance and support levels became imperative for traders. Resistance levels formed around 3,700 and 4,000, while support levels hovered at 2,600 and 2,200. The sell-off during the market's transition into 2025 brought a staggering total of 49,000 traded units on February 3, revealing a significant shift in market sentiment and the formation of a "death cross" within short-term moving averages. These signals point towards additional downside potential. Proactive investors must remain vigilant, keeping an eye on support levels that, if breached, could result in larger sell-offs or exacerbate a weak market situation. While a grim short-term outlook persists, opportunities may still materialize amid market turbulence, as adaptive strategies for price rebounds become more relevant. Ultimately, the prospect of investment requires a balanced approach—enhanced by careful monitoring and proactive decision-making—ensuring readiness for whatever lies ahead in this ever-changing landscape.
Keywords
 Ethereum
2025-03-07
Blockenza Analysis
The overall analysis suggests a bearish market condition with a potential for further declines unless investor confidence returns and critical support levels hold.
FAQs
1. What has characterized the market from October 2024 to March 2025?
The market exhibited significant volatility with a pronounced bearish trend and panic selling.
2. How did short-term price movements affect long-term market health?
Short-term rebounds did not translate to lasting market health, highlighting the need for caution.
3. What triggered panic selling in early 2025?
Panic selling was triggered by negative market news and economic reports that heightened investor fear.
4. What are the current support and resistance levels?
Support levels hover around 2100, while resistance levels are near 3450.
5. What strategies should investors consider during volatile conditions?
Investors should consider robust risk management strategies, including setting stop-loss orders and diversifying portfolios.
6. What does a 'death cross' signify?
A 'death cross' signals a potential continued decline in market prices, particularly in moving averages.
7. What trading volumes were observed during the panic selling?
Trading volumes surged to 49,000 units on February 3, 2025, indicating extreme market sentiment shifts.
8. What does MACD indicate about the market trend?
MACD indicators remaining below the zero axis suggest continued downside potential for the asset.
9. How should investors respond to support level breaches?
Investors should monitor support levels closely as breaches may trigger further sell-offs.
10. What is the overall outlook for early March 2025?
There exists potential for a market rebound, depending on stabilization and renewed investor confidence.
Related Articles
In this section, you will find articles and analyses related to this post. These materials will help you gain more information about the topic and develop a broader perspective on the digital currency market. By reading these articles, you can make more informed and precise decisions in your investment journey.
Fundamental Analysis of Ethereum on March 11, 2025
The cryptocurrency market experienced notable volatility from October 2024 to March 2025, characterized by a breakout pattern leading to an initial bullish trend before a sharp downturn occurred. Despite warnings indicated by technical indicators of bearish momentum, recent developments suggest caution as market participants monitor trading volumes and support levels for potential recovery opportunities.
Ethereum
2025-03-11

A Whale Purchased 15,292 ETH for an Average Price of $2014
A whale purchased 15,292 ETH for an average price of $2014 about ten hours ago, currently facing an unrealized loss of $2.2 million due to market fluctuations. This scenario underscores the volatility and risk associated with investing in cryptocurrencies.
Ethereum
2025-03-11

Promising Altcoins to Invest in for Your 2025 Portfolio: Web3Bay, Solana, XRP, Hedera, & Sui
As the cryptocurrency market enters a new growth phase, 2025 will likely highlight altcoins with high return potential. Investors are advised to explore a diverse range of altcoins beyond Bitcoin and Ethereum for promising investment opportunities.
Ethereum
2025-03-11

Ethereum's Decline: A Significant Drop Amid Market Challenges
Ethereum has fallen to $1,809, experiencing an 8% decline over the last day, with the BTC/ETH ratio dropping below 0.24 for the first time since February 2020. The cryptocurrency market remains volatile as investors keep a watchful eye on these developments.
Ethereum
2025-03-11

Unstoppable Crypto Access: Coinbase Launches Revolutionary 24/7 Bitcoin and Ethereum Futures
Coinbase has announced the launch of 24/7 Bitcoin and Ethereum futures, revolutionizing market access for U.S. traders. This groundbreaking move enables traders to engage with cryptocurrencies around the clock, attracting both seasoned and new investors.
Ethereum
2025-03-11
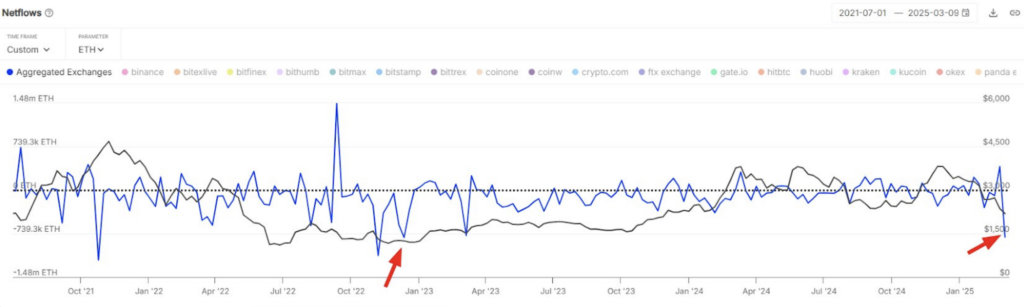
Ethereum Price Bottom? $1.8 Billion in ETH Outflow Fuels Market Speculation
Ethereum (ETH) saw its largest weekly exchange outflow of $1.8 billion since December 2022, suggesting accumulation among investors despite ongoing bearish sentiment. However, technical indicators indicate a critical resistance level that needs to be reclaimed for a confirmed price bottom.
Ethereum
2025-03-11