
Technical Analysis of Ethereum - March 6, 2025
The asset's price exhibited upward momentum until mid-November 2024, followed by a trading volume surge and subsequent fluctuations. After a correction in mid-December, the asset faced a downward trend, intensifying in late February 2025, prompting caution among investors regarding key support levels.
Article
The asset's price movement during the trading period spanning from early October to mid-November 2024 has exhibited a strikingly dynamic and often volatile pattern, indicative of the typical fluctuations that characterize most trading environments. This timeframe witnessed a pronounced upward momentum, suggesting a bullish market sentiment that encouraged investors and traders to engage more heavily in the asset. The increases in trading volumes are a clear reflection of heightened investor interest, particularly highlighted by a significant spike in activity in early November. On November 6, 2024, trading volumes peaked impressively at 12,500 units, which underscores the fervor and enthusiasm of the market participants as they capitalized on rising prices. Such a robust trading volume is generally viewed as a strong signal of a healthy market, indicating that traders were confident in the asset's upward trajectory. However, this period of bullish sentiment was followed by a series of fluctuations as traders began to take profits and new sellers emerged, causing prices to oscillate at elevated levels. Come mid-December, the asset experienced a notable correction that marked a pivotal point in its trading profile. This correction could be attributed to a combination of profit-taking behaviors from investors, an overload of sell orders, or general market adjustments as traders recalibrated their strategies. The correction laid the groundwork for a persistent decline that set in from early January to mid-February 2025, with selling pressures intensifying in late February. Such a sustained downturn often raises concerns among traders, particularly those who may have entered positions during the asset's earlier highs without securing appropriate stop-loss thresholds. Analyzing this price movement, it becomes essential to identify key resistance and support levels; they act as psychological barriers that traders frequently monitor. In this instance, resistance levels are positioned around 3,700 and 4,000. When the asset approaches these price points, selling pressure tends to increase, as traders either decide to lock in profits or anticipate a reversal in price trends. Conversely, significant support levels are detected around 2,600 and 2,200. Support levels are critical since they indicate where buyers may step in to prevent the price from declining further. Between December 19 and December 20, 2024, the market encountered considerable selling pressure, highlighting the importance of market sentiment, which can often shift swiftly due to external factors or overarching economic conditions. As the market evolved into 2025, the trading volume surged to a staggering 49,000 units on February 3, 2025, signaling a noticeable switch in market sentiment toward panic, further underscored by the formation of a "death cross" in the short-term moving averages. This trend, alongside MACD’s DIF and DEA indicators remaining below the zero axis, suggests there may be additional downside potential for the asset. Investors should remain vigilant and keep a keen eye on potential oversold bounce opportunities that may arise during such tumultuous trading conditions. Monitoring the established support levels will be crucial in the coming weeks, as any breaches could trigger further sell-offs or exacerbate an already precarious market scenario. In conclusion, while the short-term outlook may appear grim, proactive investors who adapt to shifting market conditions may still find opportunities to capitalize on price rebounds should the asset reach its support levels.
Keywords
 Ethereum
2025-03-06
Blockenza Analysis
The current trend shows a strong downward momentum, indicating that the asset is likely to continue declining in the short term, as suggested by various technical indicators.
FAQs
1. What period did the asset show upward momentum?
From early October to mid-November 2024.
2. When did trading volume surge?
In early November 2024.
3. What occurred in mid-December?
A noticeable correction took place.
4. When did the continuous decline start?
From early January to mid-February 2025.
5. What are the key resistance levels?
Around 3,700 and 4,000.
6. What are the key support levels?
Approximately 2,600 and 2,200.
7. What was the trading volume on February 3, 2025?
It reached 49,000 units.
8. What does the death cross in moving averages indicate?
It suggests a potential downward trend.
9. What should investors look for amidst market fluctuations?
Oversold bounce opportunities.
10. What technical signals indicate further downside risk?
Short-term moving averages forming a death cross and MACD indicators below the zero axis.
Related Articles
In this section, you will find articles and analyses related to this post. These materials will help you gain more information about the topic and develop a broader perspective on the digital currency market. By reading these articles, you can make more informed and precise decisions in your investment journey.

Fundamental Analysis of Ethereum on March 11, 2025
The cryptocurrency market experienced notable volatility from October 2024 to March 2025, characterized by a breakout pattern leading to an initial bullish trend before a sharp downturn occurred. Despite warnings indicated by technical indicators of bearish momentum, recent developments suggest caution as market participants monitor trading volumes and support levels for potential recovery opportunities.
Ethereum
2025-03-11

A Whale Purchased 15,292 ETH for an Average Price of $2014
A whale purchased 15,292 ETH for an average price of $2014 about ten hours ago, currently facing an unrealized loss of $2.2 million due to market fluctuations. This scenario underscores the volatility and risk associated with investing in cryptocurrencies.
Ethereum
2025-03-11

Promising Altcoins to Invest in for Your 2025 Portfolio: Web3Bay, Solana, XRP, Hedera, & Sui
As the cryptocurrency market enters a new growth phase, 2025 will likely highlight altcoins with high return potential. Investors are advised to explore a diverse range of altcoins beyond Bitcoin and Ethereum for promising investment opportunities.
Ethereum
2025-03-11

Ethereum's Decline: A Significant Drop Amid Market Challenges
Ethereum has fallen to $1,809, experiencing an 8% decline over the last day, with the BTC/ETH ratio dropping below 0.24 for the first time since February 2020. The cryptocurrency market remains volatile as investors keep a watchful eye on these developments.
Ethereum
2025-03-11

Unstoppable Crypto Access: Coinbase Launches Revolutionary 24/7 Bitcoin and Ethereum Futures
Coinbase has announced the launch of 24/7 Bitcoin and Ethereum futures, revolutionizing market access for U.S. traders. This groundbreaking move enables traders to engage with cryptocurrencies around the clock, attracting both seasoned and new investors.
Ethereum
2025-03-11
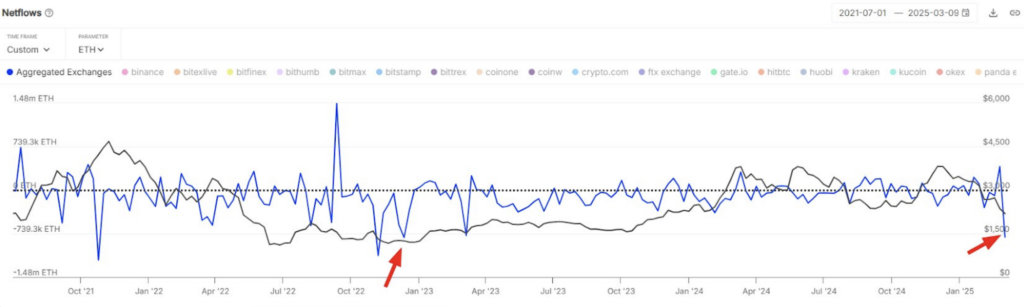
Ethereum Price Bottom? $1.8 Billion in ETH Outflow Fuels Market Speculation
Ethereum (ETH) saw its largest weekly exchange outflow of $1.8 billion since December 2022, suggesting accumulation among investors despite ongoing bearish sentiment. However, technical indicators indicate a critical resistance level that needs to be reclaimed for a confirmed price bottom.
Ethereum
2025-03-11