
Technical Analysis of Ethereum as of March 5, 2025
The market is experiencing a downward trend from October 2024 to March 2025, despite a brief uptick in November. Trading volumes have increased amid panic selling, confirming the bearish sentiment.
Article
The financial markets have long been characterized by their unpredictable nature, and the recent trends observed from early October 2024 to early March 2025 serve as a testament to this volatility. Throughout this period, we observed a clear downward oscillation in market prices, indicating that bearish sentiment has prevailed over the majority of the trading sessions. This decline has been particularly evident in major indices and stocks, as traders grapple with various economic factors that have contributed to this bearish phase. In early to mid-November 2024, there was a brief surge in market activity, leading to a temporary upward trend. However, this short-lived rally failed to manifest into a reversal of the overarching downward trend. The increase in market price during this period did not have a sustainable effect; rather, it merely provided a fleeting illusion of recovery amidst underlying bearish forces. This lack of significant rebound highlights the continued influence of negative market sentiment and broader economic pressures. One of the more concerning developments during this downward phase has been the spike in trading volumes registered on February 2 and 3, 2025. These two days were marked by panic selling, as many traders rushed to liquidate their positions in response to fear-driven market movements. The uptick in volume amidst declining prices typically signals high volatility, suggesting that investors may have been reacting to unfavorable news or poor economic indicators. Such behavior often leads to increased volatility as market participants react to the evolving situation. To analyze the current market state from a technical perspective, we turn to indicators such as the moving average system and the Macd (Moving Average Convergence Divergence) indicator. Both systems presently confirm the continuation of a downward trajectory. The moving averages are typically used to identify trends, and this bearish sentiment is illustrated by the fact that the DIF (the difference of the short-term and the long-term EMA) and the DEA (the average of the DIF) are oscillating around -180. A reading in this vicinity indicates that strong bearish forces continue to hold sway over market sentiment, thus discouraging bullish positions for the foreseeable future. Investors typically rely on support and resistance levels to navigate the tumultuous seas of the market. Currently, the most robust support level appears to be around 2100, a price point that may act as a psychological barrier for traders looking to avoid further losses. Conversely, the primary resistance level rests near 3450; this suggests that any attempts to rally towards this point would likely encounter significant selling pressure. Given the aforementioned analysis, the current market dynamics remain heavily skewed towards a sustained downward trajectory, emphasizing the need for caution among investors. In light of the continued bearish sentiment and the presence of panic selling, a conservative approach is advisable for traders and investors, particularly those whose portfolios are sensitive to market fluctuations. It may be prudent to explore strategies that prioritize risk management, given the unpredictability of market conditions and the potential for further declines. In conclusion, the downward oscillation of the market since October 2024, coupled with technical indicators confirming bearish trends and increased trading volumes indicative of panic selling, suggests that the environment for investors remains challenging. Those who choose to engage should consider adopting a prudent approach as they navigate this complex and fluctuating market landscape.
Keywords
 Ethereum
2025-03-05
Blockenza Analysis
The analysis indicates a strong potential for the price to continue falling, given the persistent bearish indicators and market conditions.
FAQs
1. What is the current market trend for Ethereum?
The current market trend shows a downward oscillation.
2. Did the market experience any upward trends recently?
Yes, there was a brief upward trend in early to mid-November 2024.
3. What indicators confirm the downward trend?
The moving average system and MACD indicator confirm the downward trend.
4. What caused the increase in trading volume?
Trading volume increased due to panic selling at key times, particularly on February 2 and 3, 2025.
5. What is the recent support level for Ethereum?
The recent important support level is around 2100.
6. What is the resistance level for Ethereum?
The resistance level is around 3450.
7. What should investors do in the short term?
Investors are advised to exercise caution due to the downward trend.
8. What do the DIF and DEA indicators indicate?
They are oscillating around -180, indicating strong bearish forces.
9. When was the brief upward trend observed?
The upward trend was observed from early to mid-November 2024.
10. What is the overall market judgment?
The overall market judgment indicates a downward trend.
Related Articles
In this section, you will find articles and analyses related to this post. These materials will help you gain more information about the topic and develop a broader perspective on the digital currency market. By reading these articles, you can make more informed and precise decisions in your investment journey.

Fundamental Analysis of Ethereum on March 11, 2025
The cryptocurrency market experienced notable volatility from October 2024 to March 2025, characterized by a breakout pattern leading to an initial bullish trend before a sharp downturn occurred. Despite warnings indicated by technical indicators of bearish momentum, recent developments suggest caution as market participants monitor trading volumes and support levels for potential recovery opportunities.
Ethereum
2025-03-11

A Whale Purchased 15,292 ETH for an Average Price of $2014
A whale purchased 15,292 ETH for an average price of $2014 about ten hours ago, currently facing an unrealized loss of $2.2 million due to market fluctuations. This scenario underscores the volatility and risk associated with investing in cryptocurrencies.
Ethereum
2025-03-11

Promising Altcoins to Invest in for Your 2025 Portfolio: Web3Bay, Solana, XRP, Hedera, & Sui
As the cryptocurrency market enters a new growth phase, 2025 will likely highlight altcoins with high return potential. Investors are advised to explore a diverse range of altcoins beyond Bitcoin and Ethereum for promising investment opportunities.
Ethereum
2025-03-11

Ethereum's Decline: A Significant Drop Amid Market Challenges
Ethereum has fallen to $1,809, experiencing an 8% decline over the last day, with the BTC/ETH ratio dropping below 0.24 for the first time since February 2020. The cryptocurrency market remains volatile as investors keep a watchful eye on these developments.
Ethereum
2025-03-11

Unstoppable Crypto Access: Coinbase Launches Revolutionary 24/7 Bitcoin and Ethereum Futures
Coinbase has announced the launch of 24/7 Bitcoin and Ethereum futures, revolutionizing market access for U.S. traders. This groundbreaking move enables traders to engage with cryptocurrencies around the clock, attracting both seasoned and new investors.
Ethereum
2025-03-11
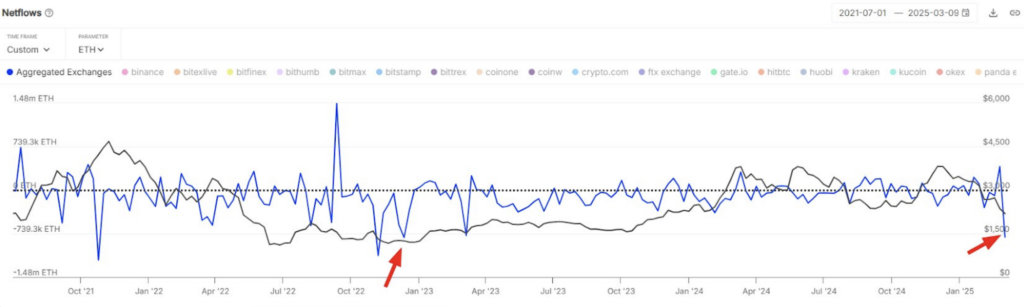
Ethereum Price Bottom? $1.8 Billion in ETH Outflow Fuels Market Speculation
Ethereum (ETH) saw its largest weekly exchange outflow of $1.8 billion since December 2022, suggesting accumulation among investors despite ongoing bearish sentiment. However, technical indicators indicate a critical resistance level that needs to be reclaimed for a confirmed price bottom.
Ethereum
2025-03-11