
Technical Analysis of Ethereum as of March 7, 2025
The cryptocurrency market from October 2024 to March 2025 witnessed an uptrend, followed by consolidation and then a downtrend, with key resistance levels at 3,700 and 4,000. With recent price declines below 2,600 and increasing selling pressure, caution is advised for investors.
Article
The cryptocurrency market is a dynamic and complex environment that can be analyzed over various timeframes. From October 2024 to March 2025, market behaviors exhibited distinct phases characterized by an initial uptrend, consolidation, and a subsequent downtrend. This period was marked by significant volatility and notable price movements, which left both seasoned investors and newcomers alike trying to comprehend the trends and their implications for future investments. During the initial uptrend, prices surged, capturing the attention of investors and speculators. Key resistance levels were observed at 3,700 and 4,000, which posed challenges as the assets tested these psychological barriers. Resistance levels are essential indicators in technical analysis as they suggest areas where the price might struggle to move through. Conversely, support levels were established at 2,300 and 2,600, indicating price points historically viewed as favorable for buyers. The establishment of these support levels provides a foundation of price stability, encouraging market participants to consider long positions. However, the market took a sharp turn on February 24, 2025 (UTC), when the price dropped below the 2,600 support level. This event triggered a downward price channel, often characterized by a series of lower highs and lower lows, suggesting persistent bearish sentiment. The breach of such significant support levels is typically viewed as a negative signal, indicating that selling pressure is overpowering buying interest. Indeed, this decline was not just a mere fluctuation; it was amplified by a surge in trading volume. Higher trading volume during a price drop indicates strong selling pressure, further substantiating the bearish sentiment in the market. The Moving Average Convergence Divergence (MACD) indicator provided further evidence of the prevailing downward trend. With a current DIF value of -173.7978, a DEA value of -158.1241, and a MACD histogram value of -15.6736, these readings implied a stark divergence in momentum favoring the bearish outlook. The negative values indicate that the bearish momentum is currently larger than any bullish counteraction, further reinforcing the market's current trend. As we look ahead into the subsequent weeks, the expectation is for a continued decline in prices due to persistent bearish sentiment and overall market conditions. However, it is essential not to overlook the potential for oversold rebounds. In volatile markets, there tend to be opportunities where assets may become undervalued in the short term, providing potential entry points for strategic investors wanting to capitalize on price corrections. Investors considering entering the market at this stage should exercise caution. While there may be prospects for making profitable trades through short-term rebounds, conditions can change rapidly, and therefore risk management strategies are crucial. Understanding one’s risk appetite and setting clear goals can aid in navigating the difficulties that may arise in the current market landscape. In conclusion, the period from October 2024 to March 2025 has seen the cryptocurrency market undergo notable fluctuations defined by major price levels, volume spikes, and significant indicators. While challenges continue, strategic analysis and cautious approaches can yield opportunities, making it necessary for investors to remain vigilant and informed amidst the evolving landscape of the cryptocurrency world.
Keywords
 Ethereum
2025-03-07
Blockenza Analysis
The analysis indicates a strong downward trend in the cryptocurrency market, forecasting further decreases in price along with increasing selling pressure.
FAQs
1. What stages did the cryptocurrency market experience?
The market experienced an uptrend, consolidation, and a downtrend.
2. What were the key resistance levels?
The key resistance levels were at 3,700 and 4,000.
3. What were the support levels identified?
The support levels identified were 2,300 and 2,600.
4. What happened on February 24, 2025?
The price fell below 2,600, entering a downward channel.
5. How did trading volume change during the downtrend?
Trading volume increased during the downtrend, indicating more selling pressure.
6. What does the MACD indicator indicate?
The MACD indicator shows that the downtrend is continuing.
7. What are the latest DIF and DEA values?
The latest DIF value is -173.7978, and the DEA value is -158.1241.
8. What is the recommendation for investors?
Investors should exercise caution due to the ongoing downtrend.
9. Is there a possibility of price rebounds?
Yes, potential oversold rebounds should be monitored.
10. What is the projected short-term price trend?
The price may continue to decline in the short term.
Related Articles
In this section, you will find articles and analyses related to this post. These materials will help you gain more information about the topic and develop a broader perspective on the digital currency market. By reading these articles, you can make more informed and precise decisions in your investment journey.

Fundamental Analysis of Ethereum on March 11, 2025
The cryptocurrency market experienced notable volatility from October 2024 to March 2025, characterized by a breakout pattern leading to an initial bullish trend before a sharp downturn occurred. Despite warnings indicated by technical indicators of bearish momentum, recent developments suggest caution as market participants monitor trading volumes and support levels for potential recovery opportunities.
Ethereum
2025-03-11

A Whale Purchased 15,292 ETH for an Average Price of $2014
A whale purchased 15,292 ETH for an average price of $2014 about ten hours ago, currently facing an unrealized loss of $2.2 million due to market fluctuations. This scenario underscores the volatility and risk associated with investing in cryptocurrencies.
Ethereum
2025-03-11

Promising Altcoins to Invest in for Your 2025 Portfolio: Web3Bay, Solana, XRP, Hedera, & Sui
As the cryptocurrency market enters a new growth phase, 2025 will likely highlight altcoins with high return potential. Investors are advised to explore a diverse range of altcoins beyond Bitcoin and Ethereum for promising investment opportunities.
Ethereum
2025-03-11

Ethereum's Decline: A Significant Drop Amid Market Challenges
Ethereum has fallen to $1,809, experiencing an 8% decline over the last day, with the BTC/ETH ratio dropping below 0.24 for the first time since February 2020. The cryptocurrency market remains volatile as investors keep a watchful eye on these developments.
Ethereum
2025-03-11

Unstoppable Crypto Access: Coinbase Launches Revolutionary 24/7 Bitcoin and Ethereum Futures
Coinbase has announced the launch of 24/7 Bitcoin and Ethereum futures, revolutionizing market access for U.S. traders. This groundbreaking move enables traders to engage with cryptocurrencies around the clock, attracting both seasoned and new investors.
Ethereum
2025-03-11
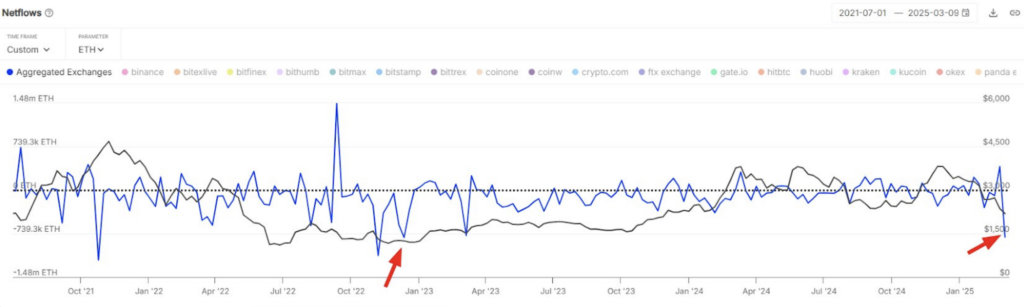
Ethereum Price Bottom? $1.8 Billion in ETH Outflow Fuels Market Speculation
Ethereum (ETH) saw its largest weekly exchange outflow of $1.8 billion since December 2022, suggesting accumulation among investors despite ongoing bearish sentiment. However, technical indicators indicate a critical resistance level that needs to be reclaimed for a confirmed price bottom.
Ethereum
2025-03-11