
Technical Analysis of Ethereum from January to March 2025
Ethereum's market shows a significant downward trend from January 2025, with increased selling pressure. During this period, trading volumes have decreased, indicating caution for investors, particularly at the key support level of 2237.
Article
### Analyzing Market Trends: A Comprehensive Look at Recent Developments The financial landscape often provides insights through intricate patterns and trailing indicators, and recent market trends from October 2024 to early 2025 provide a pertinent case study. Following a period of notable oscillation, the market appeared to stabilize, displaying upward movements leading into early November 2024 (UTC). However, this positive trajectory was short-lived, as evidenced by an emerging downward trend in January 2025 (UTC). Understanding these fluctuations is essential for investors who aim to make informed decisions rather than act impulsively based on fleeting market movements. One significant signal indicating a shift in market dynamics was detected on January 7, 2025 (UTC), when the short-term moving average fell below its long-term counterpart. This technical indicator is widely regarded as a bearish signal; it suggests that momentum in the market has turned negative. Alongside this development, the Moving Average Convergence Divergence (MACD) indicator, which is crucial for determining underlying price trends, revealed concerning signals as both the DIF line and DEA line exhibited a continued decline. Their descent into the negative zone serves as a stark warning of increasing selling pressure, suggesting that investors should adopt a cautious approach in forthcoming market activities. Revenue generation in trading commonly comes with volume fluctuations, and this pattern plays a vital role in understanding market sentiment. Notably, trading volume peaked at an impressive 48,989 units on February 3, 2025 (UTC). However, this surge was not sustained. By February 25, the volume had dropped to 26,139 units, and further slumped to 22,600 units by February 28. This diminishing volume is indicative of waning interest from buyers, reinforcing the notion that bearish sentiment is prevalent among investors, further corroborating the identified selling pressure. Given these signals, it is imperative that investors remain vigilant and mindful of key support levels within the market. The steadfast support level of 2237 has emerged as a crucial linchpin for market stability. A breach of this level could signify a deeper plunge in market valuations, compelling market participants to reassess their strategies. Indeed, seasoned investors recognize that patience and vigilance are critical when navigating such uncertain territories, particularly when overarching trends hint at further declines. Risk management is a cornerstone of successful investing, particularly in volatile markets. Market participants are encouraged to deploy robust risk control measures—including stop-loss orders or diversification strategies—to mitigate potential losses. Additionally, keeping abreast of broader economic indicators, geopolitical developments, and other influential factors is essential in painting a holistic picture of market health and potential risks. In conclusion, the evolving market landscape from late 2024 into early 2025 presents both challenges and opportunities for astute investors. While current trends indicate heightened selling pressure, an understanding of technical indicators and trading volumes can empower investors to make well-informed decisions. A focus on key support levels and diligent risk management strategies will prove vital as the market navigates this complex terrain. Thus, an analytical approach, tempered with caution and informed decision-making, remains paramount to achieving long-term success in the financial markets.
Keywords
 Ethereum
2025-03-01
Blockenza Analysis
The current trends indicate a downward market motion with significant selling pressure. Investors should be prepared for possible further declines.
FAQs
1. What trend did the market show after early October 2024?
The market showed an upward oscillation until early November 2024.
2. What happened to the market trend in January 2025?
The market turned into a downward trend.
3. What occurred on January 7, 2025, regarding moving averages?
The short-term moving average fell below the long-term moving average.
4. What did the MACD indicator indicate?
The MACD indicator's DIF line and DEA line continued to decline, entering the negative zone, indicating increased selling pressure.
5. What was the peak trading volume recorded?
The peak trading volume recorded was 48,989 units on February 3, 2025.
6. What trading volume was recorded on February 25, 2025?
A trading volume of 26,139 units was recorded on February 25, 2025.
7. What should investors focus on according to the analysis?
Investors should focus on the key support level of 2237.
8. What does the decrease in trading volume suggest?
The decrease in trading volume suggests increased selling pressure.
9. What is the suggested investor action based on the analysis?
Investors should remain cautious and pay attention to risk control.
10. Is there a possibility for the market to continue declining?
Yes, the analyses suggest that the market may continue to decline.
Related Articles
In this section, you will find articles and analyses related to this post. These materials will help you gain more information about the topic and develop a broader perspective on the digital currency market. By reading these articles, you can make more informed and precise decisions in your investment journey.

Fundamental Analysis of Ethereum on March 11, 2025
The cryptocurrency market experienced notable volatility from October 2024 to March 2025, characterized by a breakout pattern leading to an initial bullish trend before a sharp downturn occurred. Despite warnings indicated by technical indicators of bearish momentum, recent developments suggest caution as market participants monitor trading volumes and support levels for potential recovery opportunities.
Ethereum
2025-03-11

A Whale Purchased 15,292 ETH for an Average Price of $2014
A whale purchased 15,292 ETH for an average price of $2014 about ten hours ago, currently facing an unrealized loss of $2.2 million due to market fluctuations. This scenario underscores the volatility and risk associated with investing in cryptocurrencies.
Ethereum
2025-03-11

Promising Altcoins to Invest in for Your 2025 Portfolio: Web3Bay, Solana, XRP, Hedera, & Sui
As the cryptocurrency market enters a new growth phase, 2025 will likely highlight altcoins with high return potential. Investors are advised to explore a diverse range of altcoins beyond Bitcoin and Ethereum for promising investment opportunities.
Ethereum
2025-03-11

Ethereum's Decline: A Significant Drop Amid Market Challenges
Ethereum has fallen to $1,809, experiencing an 8% decline over the last day, with the BTC/ETH ratio dropping below 0.24 for the first time since February 2020. The cryptocurrency market remains volatile as investors keep a watchful eye on these developments.
Ethereum
2025-03-11

Unstoppable Crypto Access: Coinbase Launches Revolutionary 24/7 Bitcoin and Ethereum Futures
Coinbase has announced the launch of 24/7 Bitcoin and Ethereum futures, revolutionizing market access for U.S. traders. This groundbreaking move enables traders to engage with cryptocurrencies around the clock, attracting both seasoned and new investors.
Ethereum
2025-03-11
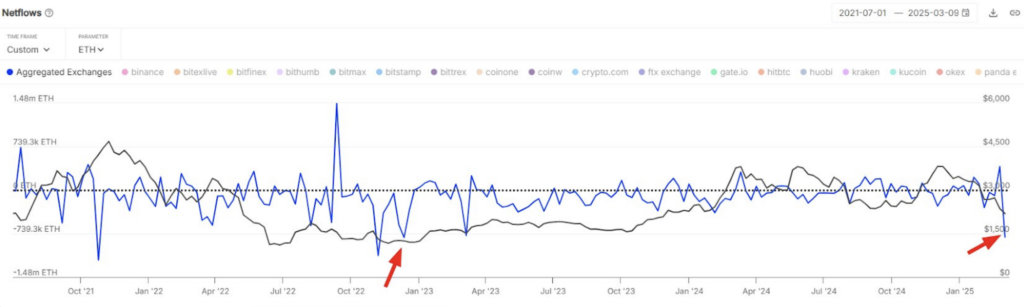
Ethereum Price Bottom? $1.8 Billion in ETH Outflow Fuels Market Speculation
Ethereum (ETH) saw its largest weekly exchange outflow of $1.8 billion since December 2022, suggesting accumulation among investors despite ongoing bearish sentiment. However, technical indicators indicate a critical resistance level that needs to be reclaimed for a confirmed price bottom.
Ethereum
2025-03-11