
Technical Analysis of Ethereum on February 25, 2025
The market shows a descending triangle pattern with strong support at 2500 and resistance between 3200-3300. The MACD indicator indicates upward momentum, while the moving averages remain bearish, emphasizing the need to monitor the support level closely.
Article
As we approach the end of February 2025, market analysts are closely observing the ongoing price dynamics of various traded assets. The current landscape painted by price movements suggests the formation of a descending triangle pattern, a technical structure that typically signifies potential price changes and eventual trend reversals. In particular, the recent trading session on February 24, 2025 (UTC), has caught the attention of traders, as it formed a significant long lower shadow. This shadow reached down to a low point of 2484.83, indicating the presence of strong buying interest at this level, which establishes a solid support structure around the psychologically significant mark of 2500. Support levels are critical in technical analysis, serving as price points where buyers are expected to enter the market in sufficient quantities to halt or reverse a declining price trend. The establishment of support around 2500 suggests that market participants see value in buying at this level, making it an essential price point to monitor. Conversely, it is equally important to note the primary resistance zone located between 3200 and 3300. This zone represents a significant hurdle for upward price movements, and breaking through it could indicate a shift in market sentiment and a potential bullish reversal in the medium term. Adding more depth to this analysis, the Moving Average Convergence Divergence (MACD) indicator, a favorite tool among traders for identifying trend reversals and momentum shifts, reveals fascinating insights. On February 24, the MACD shows a transition from a negative to a positive stance, with the DIF (the difference between the 12-day and 26-day exponential moving averages) recorded at -93.87 and the DEA (the nine-day EMA of the DIF) at -112.2. This shift signifies the accumulation of positive momentum, suggesting that the market may be gearing up for a potential rally if buying interest can sustain itself. Furthermore, the trading volume of 17.25 units on February 24 is particularly noteworthy. This figure indicates a considerable increase compared to previous periods and aligns with the long lower shadow formation—a classic indicator of a potential bottom. High trading volumes during price declines can validate a market bottom, as they represent heightened interest and participation among buyers. However, caution is warranted. Despite these bullish indicators, the moving average system still presents a bearish alignment. The short-term moving average is currently positioned at 2697.56, sitting comfortably below the long-term moving average of 2816.47. This alignment indicates that the prevailing trend remains downward, and traders should remain vigilant regarding the overall market direction. The focus for market watchers will remain on whether the key support level around 2500 can withstand potential sell-offs. A decisive break below this level could send bearish signals and provoke further declines, while maintaining it could provide the necessary foundation for a bullish advance toward the resistance zone. In conclusion, the emerging technical indicators from the market present a compelling scenario filled with potential. The interplay between the established support level of 2500, the resistance zone at 3200-3300, and the shifts indicated by the MACD and trading volumes may influence the trajectory of prices in the near future. As the market navigates these critical junctures, traders and investors alike should adopt a strategic approach, considering both bullish signals and potential bearish trends in their decision-making processes.
Keywords
 Ethereum
2025-02-25
Blockenza Analysis
The analysis suggests a cautious outlook; while there are signs of upward momentum, the market remains in a bearish trend, leading to a score of 40.
FAQs
1. What does the descending triangle pattern indicate?
It suggests potential price movements towards a breakout either up or down.
2. What was the low point for the market on February 24, 2025?
The low point was 2484.83.
3. Where is the main resistance zone?
The main resistance zone is between 3200-3300.
4. What does the MACD indicator imply?
It implies an accumulation of upward momentum.
5. What was the trading volume on February 24, 2025?
The trading volume was 17.25 units.
6. What does the long lower shadow indicate?
It indicates strong support at the 2500 level.
7. Are the moving averages currently bullish?
No, they are aligned bearishly.
8. What should traders monitor according to the analysis?
Traders should monitor whether the 2500 support level can be maintained.
9. What does the differentiation between short-term and long-term moving averages suggest?
It suggests a bearish trend since the short-term is below the long-term average.
10. Is an upward breakout likely according to the analysis?
An upward breakout is possible if the resistance zone is breached.
Related Articles
In this section, you will find articles and analyses related to this post. These materials will help you gain more information about the topic and develop a broader perspective on the digital currency market. By reading these articles, you can make more informed and precise decisions in your investment journey.

Fundamental Analysis of Ethereum on March 11, 2025
The cryptocurrency market experienced notable volatility from October 2024 to March 2025, characterized by a breakout pattern leading to an initial bullish trend before a sharp downturn occurred. Despite warnings indicated by technical indicators of bearish momentum, recent developments suggest caution as market participants monitor trading volumes and support levels for potential recovery opportunities.
Ethereum
2025-03-11

A Whale Purchased 15,292 ETH for an Average Price of $2014
A whale purchased 15,292 ETH for an average price of $2014 about ten hours ago, currently facing an unrealized loss of $2.2 million due to market fluctuations. This scenario underscores the volatility and risk associated with investing in cryptocurrencies.
Ethereum
2025-03-11

Promising Altcoins to Invest in for Your 2025 Portfolio: Web3Bay, Solana, XRP, Hedera, & Sui
As the cryptocurrency market enters a new growth phase, 2025 will likely highlight altcoins with high return potential. Investors are advised to explore a diverse range of altcoins beyond Bitcoin and Ethereum for promising investment opportunities.
Ethereum
2025-03-11

Ethereum's Decline: A Significant Drop Amid Market Challenges
Ethereum has fallen to $1,809, experiencing an 8% decline over the last day, with the BTC/ETH ratio dropping below 0.24 for the first time since February 2020. The cryptocurrency market remains volatile as investors keep a watchful eye on these developments.
Ethereum
2025-03-11

Unstoppable Crypto Access: Coinbase Launches Revolutionary 24/7 Bitcoin and Ethereum Futures
Coinbase has announced the launch of 24/7 Bitcoin and Ethereum futures, revolutionizing market access for U.S. traders. This groundbreaking move enables traders to engage with cryptocurrencies around the clock, attracting both seasoned and new investors.
Ethereum
2025-03-11
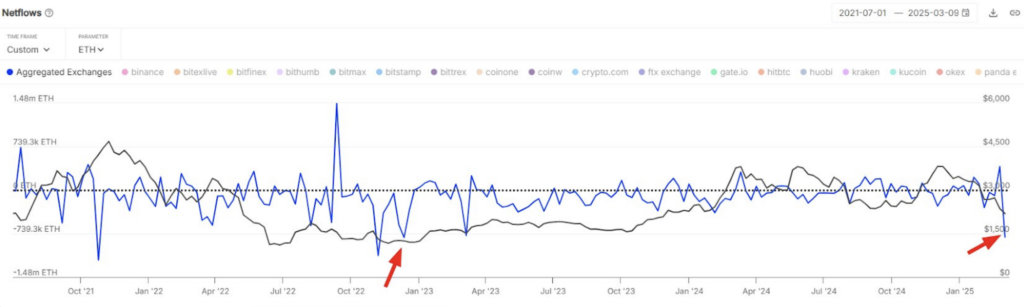
Ethereum Price Bottom? $1.8 Billion in ETH Outflow Fuels Market Speculation
Ethereum (ETH) saw its largest weekly exchange outflow of $1.8 billion since December 2022, suggesting accumulation among investors despite ongoing bearish sentiment. However, technical indicators indicate a critical resistance level that needs to be reclaimed for a confirmed price bottom.
Ethereum
2025-03-11