
Technical Analysis of Ethereum on February 26, 2025
The market is currently on a downward trend after forming a double top pattern and experiencing significant selling pressure. Investors are advised to wait for stabilization signals before entering the market.
Article
The current state of the market is characterized by a pronounced downward trend that investors have been closely monitoring. On February 23, the market formed a double top pattern at a critical price point of 2850.00 (UTC). This particular pattern is often seen as a bearish indicator, suggesting that the asset has hit a resistance level that could thwart any further upward movement. Following this pattern, the market witnessed a significant decrease in price, which sent shockwaves through trading floors. This downturn was particularly noticeable during the two consecutive trading sessions that featured long upper wick candlesticks. These candlesticks are indicative of heavy selling pressure, suggesting that, despite attempts to push the prices higher, an overwhelming amount of selling occurred, further driving prices down. Such candlestick patterns are often interpreted as a warning to investors that the market is struggling to maintain upward momentum, often leading to a more extensive correction. In the wake of these developments, traders and analysts have identified a critical support level at 2330.0. This support level serves as a psychological barrier for many investors—if prices dip below this level, it could trigger further sell-offs and exacerbate the bearish sentiment. Conversely, the paramount resistance level remains firmly at 2850.0, a price point that the market has struggled to break through during its recent attempts at recovery. Additionally, current trading volumes have surged significantly, reaching 26,139.65 units on February 25 (UTC). This figure is markedly higher than average trading volumes seen in previous sessions, further accentuating the presence of strong selling pressure in the market. High trading volumes can indicate heightened investor activity and often precede significant price shifts. In this case, the elevated volume reflects a rush among traders to exit positions as prices declined, signaling fear and uncertainty among investors. Analyzing the market trends utilizing various technical indicators shows a bearish sentiment prevailing through the moving average system. The short-term moving average has seen a sharp decline, dropping from 2730.15 to 2672.49, reinforcing the idea of a downward trajectory. As traders look at these figures, it becomes essential to consider that moving averages often provide a smoother view of price action over a specific period. The steep drop in the short-term average suggests that any hope for recovery remains tenuous at best. However, amidst this overwhelming bearish trend, some flickers of potential recovery can be detected. The MACD (Moving Average Convergence Divergence) histogram has shown a recent transition from negative to positive at a value of 7.038. This crossover could suggest a potential shift in momentum, hinting at a possible technical rebound in the near future. Traders will often watch for these shifts closely, as a bullish signal from the MACD can serve as a precursor to upward price movements. In conclusion, the market currently finds itself navigating through turbulent waters marked by significant bearish pressure and volatility. Investors must exercise caution as they monitor the unfolding situation. Given the multiple indicators of a possible turning point—the critical support levels, potential positive shifts in the MACD, and sharp contractions in trading volumes—it's vital for investors to remain vigilant. Being prudent and awaiting clear signals of stabilization before engaging in market activities will be key in navigating these challenging conditions. Only time will tell if the negative momentum can be wrestled back into a more favorable market environment.
Keywords
 Ethereum
2025-02-26
Blockenza Analysis
Given the current bearish trend and significant selling pressure, it is expected that the price will continue to fall.
FAQs
1. What is the current market trend?
The market is showing a clear downward trend.
2. What pattern did the market form?
The market formed a double top pattern at 2850.00.
3. What is the key support level?
The key support level is at 2330.0.
4. What is the main resistance level?
The main resistance level is at 2850.0.
5. What happened to trading volume on February 25?
The trading volume increased significantly to 26,139.65 units.
6. What does the moving average system indicate?
The moving average system is in a bearish alignment.
7. What is the short-term moving average trend?
The short-term moving average is rapidly falling.
8. What does the MACD histogram suggest?
The MACD histogram has turned from negative to positive, indicating a possible technical rebound.
9. What should investors do at this stage?
Investors are advised to exercise caution and wait for stabilization signals.
10. What was the price on February 23?
The price was at 2850.00.
Related Articles
In this section, you will find articles and analyses related to this post. These materials will help you gain more information about the topic and develop a broader perspective on the digital currency market. By reading these articles, you can make more informed and precise decisions in your investment journey.

Fundamental Analysis of Ethereum on March 11, 2025
The cryptocurrency market experienced notable volatility from October 2024 to March 2025, characterized by a breakout pattern leading to an initial bullish trend before a sharp downturn occurred. Despite warnings indicated by technical indicators of bearish momentum, recent developments suggest caution as market participants monitor trading volumes and support levels for potential recovery opportunities.
Ethereum
2025-03-11

A Whale Purchased 15,292 ETH for an Average Price of $2014
A whale purchased 15,292 ETH for an average price of $2014 about ten hours ago, currently facing an unrealized loss of $2.2 million due to market fluctuations. This scenario underscores the volatility and risk associated with investing in cryptocurrencies.
Ethereum
2025-03-11

Promising Altcoins to Invest in for Your 2025 Portfolio: Web3Bay, Solana, XRP, Hedera, & Sui
As the cryptocurrency market enters a new growth phase, 2025 will likely highlight altcoins with high return potential. Investors are advised to explore a diverse range of altcoins beyond Bitcoin and Ethereum for promising investment opportunities.
Ethereum
2025-03-11

Ethereum's Decline: A Significant Drop Amid Market Challenges
Ethereum has fallen to $1,809, experiencing an 8% decline over the last day, with the BTC/ETH ratio dropping below 0.24 for the first time since February 2020. The cryptocurrency market remains volatile as investors keep a watchful eye on these developments.
Ethereum
2025-03-11

Unstoppable Crypto Access: Coinbase Launches Revolutionary 24/7 Bitcoin and Ethereum Futures
Coinbase has announced the launch of 24/7 Bitcoin and Ethereum futures, revolutionizing market access for U.S. traders. This groundbreaking move enables traders to engage with cryptocurrencies around the clock, attracting both seasoned and new investors.
Ethereum
2025-03-11
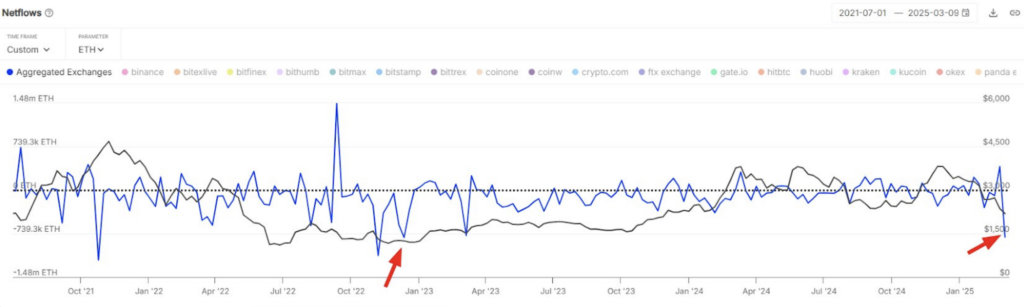
Ethereum Price Bottom? $1.8 Billion in ETH Outflow Fuels Market Speculation
Ethereum (ETH) saw its largest weekly exchange outflow of $1.8 billion since December 2022, suggesting accumulation among investors despite ongoing bearish sentiment. However, technical indicators indicate a critical resistance level that needs to be reclaimed for a confirmed price bottom.
Ethereum
2025-03-11