
Technical Analysis of Ethereum on March 10, 2025
The market has experienced significant fluctuations, with a breakout on October 14, 2024, and a potential short-term top in December. Recent trends suggest a continuing downward movement, but decreasing trading volume may hint at stabilization.
Article
On October 14, 2024 (UTC), the cryptocurrency market demonstrated compelling signs of volatility, characterized prominently by a breakout pattern. Notably, this breakout was marked by an uptick in trading volume, signaling heightened investor activity and interest. As market participants began to recognize the potential for upward trends, the momentum solidified with the emergence of substantial green candles on November 6 and November 7 (UTC). These bullish candles were not mere fluctuations; they served to confirm a budding bullish trend that had investors eagerly anticipating further price increases. However, this upward trajectory was interrupted when the market experienced a sharp decline on December 18 and 19 (UTC). This sudden downturn raised alarms among traders, suggesting the possibility of a short-term peak in prices, a phenomenon that often leads to increased market volatility. By early February 2025 (UTC), the market faced a dramatic sell-off, indicative of panic among traders. On February 3 (UTC), trading volume spiked alarmingly to 48,900 coins, further illustrating the extent of the distress among investors. This influx of activity was a clear indicator that many were eager to cut their losses in a rapidly declining market. In the wake of these events, previously established resistance levels at 3,400, 3,700, and 4,000 appeared overshadowed by a concerning loss of crucial support levels, particularly the pivotal 2,600 mark. The breach of this support zone was alarming as it signaled that bearish sentiment had gained traction. By February 2025 (UTC), technical indicators began to converge towards a decidedly bearish outlook. The short-term moving averages produced a death cross, a pattern typically indicating a shift from a bullish to a bearish trend. This transition served as a warning sign for investors, as it suggested that further declines might be imminent. Additionally, the Moving Average Convergence Divergence (MACD) indicator aligned with this bearish sentiment, reinforcing the cautionary atmosphere prevailing in the market. Traders and investors alike began to brace themselves for the potential fallout that typically follows such patterns. However, amidst this overall decline, there was an intriguing development—trading volume experienced a recent decline, which could signify a potential waning of the downward momentum. While this might suggest that panic selling is easing, it does not automatically imply a reversal in the market trend. As the cryptocurrency landscape continues to evolve, investors would be wise to remain vigilant, paying close attention to various market indicators. Monitoring these signals could offer key insights into the potential stabilization of the market. For instance, a return of increased trading volume alongside a reaffirmation of support levels could hint at recovery and renewed confidence from investors. Additionally, aspects such as broader market trends, regulatory news, and macroeconomic factors could heavily influence the direction the market takes in the near future. In conclusion, while the crypto market displayed remarkable bullish potential in late 2024, shifting trends and technical indicators have introduced a level of uncertainty that calls for caution. Investors should not only observe past trends but also remain proactive in analyzing current indicators to navigate the complexities of the market successfully. As always, an investor's best strategy is remaining informed and adaptable in the face of an ever-changing landscape.
Keywords
 Ethereum
2025-03-10
Blockenza Analysis
The overall analysis indicates a continuing downward trend in the market. Despite the recent drop in trading volume which might reflect a weakening bearish sentiment, the indicators suggest that the likelihood of further declines is stronger than a price recovery at this time.
FAQs
1. What happened on October 14, 2024?
The market exhibited a breakout pattern with increased trading volume.
2. When were the large green candles observed?
Large green candles were observed on November 6 and 7, 2024.
3. What indicated a potential short-term top?
The significant decline on December 18 and 19, 2024, may signal a short-term top.
4. What occurred in early February 2025?
In early February 2025, there was a cliff-like drop with a trading volume of 48,900 coins.
5. What were the support levels prior to February 2025?
The support levels were at 3,200, 3,000, and 2,600.
6. What was the critical support level lost in February 2025?
The support at 2,600 was lost in February 2025.
7. What did the short-term moving averages form in February 2025?
The short-term moving averages formed a death cross.
8. What did the MACD indicator show?
The MACD indicator showed a continuation of the downward trend.
9. What does the decrease in trading volume suggest?
The decrease in trading volume may suggest a weakening of the downward momentum.
10. What should investors monitor for market stabilization?
Investors should monitor various indicators for signs of stabilization.
Related Articles
In this section, you will find articles and analyses related to this post. These materials will help you gain more information about the topic and develop a broader perspective on the digital currency market. By reading these articles, you can make more informed and precise decisions in your investment journey.

Fundamental Analysis of Ethereum on March 11, 2025
The cryptocurrency market experienced notable volatility from October 2024 to March 2025, characterized by a breakout pattern leading to an initial bullish trend before a sharp downturn occurred. Despite warnings indicated by technical indicators of bearish momentum, recent developments suggest caution as market participants monitor trading volumes and support levels for potential recovery opportunities.
Ethereum
2025-03-11

A Whale Purchased 15,292 ETH for an Average Price of $2014
A whale purchased 15,292 ETH for an average price of $2014 about ten hours ago, currently facing an unrealized loss of $2.2 million due to market fluctuations. This scenario underscores the volatility and risk associated with investing in cryptocurrencies.
Ethereum
2025-03-11

Promising Altcoins to Invest in for Your 2025 Portfolio: Web3Bay, Solana, XRP, Hedera, & Sui
As the cryptocurrency market enters a new growth phase, 2025 will likely highlight altcoins with high return potential. Investors are advised to explore a diverse range of altcoins beyond Bitcoin and Ethereum for promising investment opportunities.
Ethereum
2025-03-11

Ethereum's Decline: A Significant Drop Amid Market Challenges
Ethereum has fallen to $1,809, experiencing an 8% decline over the last day, with the BTC/ETH ratio dropping below 0.24 for the first time since February 2020. The cryptocurrency market remains volatile as investors keep a watchful eye on these developments.
Ethereum
2025-03-11

Unstoppable Crypto Access: Coinbase Launches Revolutionary 24/7 Bitcoin and Ethereum Futures
Coinbase has announced the launch of 24/7 Bitcoin and Ethereum futures, revolutionizing market access for U.S. traders. This groundbreaking move enables traders to engage with cryptocurrencies around the clock, attracting both seasoned and new investors.
Ethereum
2025-03-11
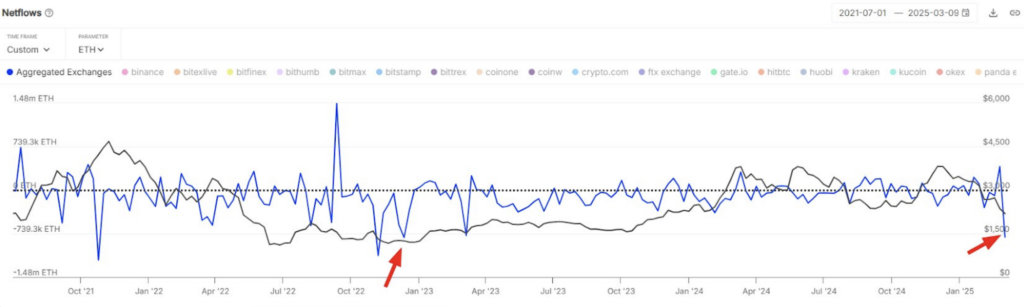
Ethereum Price Bottom? $1.8 Billion in ETH Outflow Fuels Market Speculation
Ethereum (ETH) saw its largest weekly exchange outflow of $1.8 billion since December 2022, suggesting accumulation among investors despite ongoing bearish sentiment. However, technical indicators indicate a critical resistance level that needs to be reclaimed for a confirmed price bottom.
Ethereum
2025-03-11