
Technical Analysis of Ethereum on March 11, 2025
The market showed a correction phase starting in mid-December 2024 after an upward trend, leading to a significant drop in early February 2025. Key resistance and support levels have been identified, with indicators reflecting a bearish trend.
Article
In the ever-evolving landscape of financial markets, understanding market patterns is crucial for investors and traders alike. The timeframe from mid-October to mid-November 2024 illustrated a robust trend of upward oscillation, where various assets experienced price gains. This ascension offered a glimmer of hope to many investors who observed their portfolios swell as bullish sentiment pervaded the market. Investors celebrated the moment, buoyed by positive economic indicators and optimism about future market performance. However, this upswing was not to last. A significant market correction kicked off in mid-December as selling pressure began to intensify. Asset prices experienced downward momentum as uncertainty crept in, leading to a sharp decline in investor confidence. This downward spiral continued to persist into January and February 2025, when conditions culminated in a notable market crash on February 3 (UTC). Reports indicated widespread panic and fear among investors, with many choosing to liquidate their positions to avoid greater losses. Within a matter of days, what had once seemed like a bull market transformed into a bear market, leaving investors grappling to make sense of their strategies. In examining the market's resistance and support levels during this volatile period, noteworthy points emerged. Resistance levels, which often indicate points where prices struggle to rise due to increased selling interest, were identified around 3450, 3700, and 4000. These levels acted like invisible ceilings, pushing back against upward price action. On the flip side, essential support levels—prices at which demand is strong enough to prevent further declines—were positioned at critical thresholds, with approximately 3200, 3000, 2800, 2600, and 2200 being significant markers that warranted attention. Investors keen on protecting their investments kept a close eye on the vital support level near 2000, recognizing it as a potential launchpad for a rebound should investor sentiment shift. During this prolonged downward trajectory, the surge in trading volume became undeniable, reaching a peak of 48,900 on February 3 (UTC). This increase was indicative of heightened activity as traders rushed to either capitalize on dip-buying opportunities or divest from their positions, thus reflecting the market's underlying volatility and their emotional responses to fluctuating valuations. In conjunction with these price movements, technical indicators such as the Moving Average Convergence Divergence (MACD) were painting a stark picture of market sentiment. The MACD, which helps assess the momentum of price movements, displayed significant negative momentum. As of March 10 (UTC), the Difference Line (DIF) was recorded at -199.0 while the Exponential Moving Average (DEA) stood at -173.8. Compounding the bearish sentiment was a histogram reading of -25.18, reinforcing the notion that the market was firmly entrenched within a bearish trend. The prevailing outlook for the upcoming weeks suggests that continued declines might be on the horizon. Consequently, investors face an imperative to scrutinize support levels meticulously and remain vigilant for potential rebounds, particularly from oversold conditions. As the market navigates through these tumultuous times, prudence, informed analysis, and a keen understanding of market signals will play pivotal roles in shaping investment strategies moving forward. It remains a turbulent yet fascinating period for investors, as they adapt to the changing tides of this dynamic marketplace.
Keywords
 Ethereum
2025-03-11
Blockenza Analysis
The market is exhibiting a strong downward trend with significant panic selling. Indicators suggest a continuing decline in prices, warranting caution for potential investments.
FAQs
1. What occurred from mid-October to mid-November 2024?
The market oscillated upwards during this period.
2. When did the market begin to correct?
The market began to correct in mid-December 2024.
3. What happened on February 3, 2025?
There was a massive drop that indicated a state of panic.
4. What are the key resistance levels mentioned?
The key resistance levels are around 3450, 3700, and 4000.
5. What are the critical support levels?
The key support levels are around 3200, 3000, 2800, 2600, and 2200.
6. What was the trading volume on February 3, 2025?
The trading volume reached a recent high of 48,900.
7. What do the MACD indicators signify?
The MACD indicators indicate a strong bearish trend.
8. How does the overall market trend appear?
The overall trend is downward.
9. What is essential to monitor during this phase?
It's important to monitor the performance of support levels.
10. What should investors look for in the market now?
Investors should look for opportunities for oversold rebounds.
Related Articles
In this section, you will find articles and analyses related to this post. These materials will help you gain more information about the topic and develop a broader perspective on the digital currency market. By reading these articles, you can make more informed and precise decisions in your investment journey.

Fundamental Analysis of Ethereum on March 11, 2025
The cryptocurrency market experienced notable volatility from October 2024 to March 2025, characterized by a breakout pattern leading to an initial bullish trend before a sharp downturn occurred. Despite warnings indicated by technical indicators of bearish momentum, recent developments suggest caution as market participants monitor trading volumes and support levels for potential recovery opportunities.
Ethereum
2025-03-11

A Whale Purchased 15,292 ETH for an Average Price of $2014
A whale purchased 15,292 ETH for an average price of $2014 about ten hours ago, currently facing an unrealized loss of $2.2 million due to market fluctuations. This scenario underscores the volatility and risk associated with investing in cryptocurrencies.
Ethereum
2025-03-11

Promising Altcoins to Invest in for Your 2025 Portfolio: Web3Bay, Solana, XRP, Hedera, & Sui
As the cryptocurrency market enters a new growth phase, 2025 will likely highlight altcoins with high return potential. Investors are advised to explore a diverse range of altcoins beyond Bitcoin and Ethereum for promising investment opportunities.
Ethereum
2025-03-11

Ethereum's Decline: A Significant Drop Amid Market Challenges
Ethereum has fallen to $1,809, experiencing an 8% decline over the last day, with the BTC/ETH ratio dropping below 0.24 for the first time since February 2020. The cryptocurrency market remains volatile as investors keep a watchful eye on these developments.
Ethereum
2025-03-11

Unstoppable Crypto Access: Coinbase Launches Revolutionary 24/7 Bitcoin and Ethereum Futures
Coinbase has announced the launch of 24/7 Bitcoin and Ethereum futures, revolutionizing market access for U.S. traders. This groundbreaking move enables traders to engage with cryptocurrencies around the clock, attracting both seasoned and new investors.
Ethereum
2025-03-11
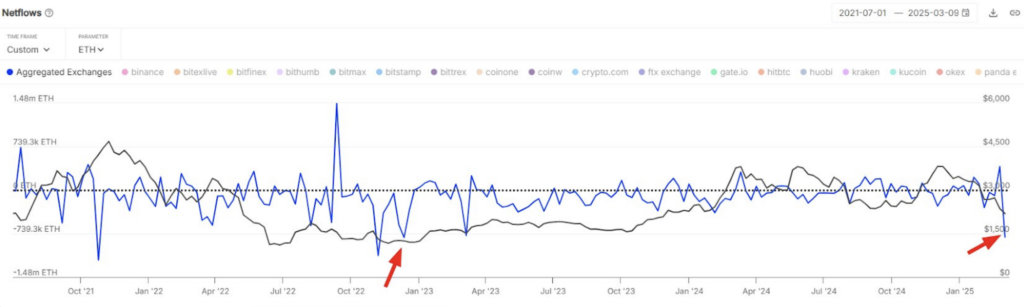
Ethereum Price Bottom? $1.8 Billion in ETH Outflow Fuels Market Speculation
Ethereum (ETH) saw its largest weekly exchange outflow of $1.8 billion since December 2022, suggesting accumulation among investors despite ongoing bearish sentiment. However, technical indicators indicate a critical resistance level that needs to be reclaimed for a confirmed price bottom.
Ethereum
2025-03-11