
Technical Analysis of Ethereum on March 4, 2025
The cryptocurrency is expected to rise from early October to mid-November 2024, before declining until hitting a low in early February 2025. A short-term rebound may occur in early March 2025 as support emerges around 2200.
Article
As we transition into the latter part of 2024, a discernible cryptocurrency pattern has emerged, suggesting a significant upward fluctuation in the markets from early October to mid-November 2024. This trend, while promising for short-term investors, may not last indefinitely. Experts predict a behavioral reversal in the cryptocurrency landscape, where the markets will begin to experience a decline starting from mid-December 2024, hitting the bottom around early February 2025, composite figures indicating that investors should be bracing themselves for a volatile period. Understanding this anticipated downturn is crucial for traders and investors alike. The forecast suggests that the prices will experience a low point in early February 2025, coinciding with broader market trends which often see seasonal dips in investor sentiment. This anticipated drop serves as a stark reminder of the inherent volatility of cryptocurrency, where market confidence can sway dramatically over short periods. As we move towards early March 2025, however, a shift in momentum may be on the horizon. Analysts predict a volume-driven rise as many investors may decide to capitalize on depressed prices, leading to an anticipated short-term rebound during this period. It’s essential during this time to keep a close eye on key resistance and support levels that have been architected throughout the preceding trading periods. Resistance levels are likely to be established around the 3400, 3700, and 4000 marks—these are crucial thresholds that, if breached, could indicate a continuation of upward movement. Conversely, the support levels forecasted at approximately 3200, 3000, 2800, and 2200 will serve as the stocks' safety nets, where prices might rebound if they fall through them. Considering the anticipated price movements, there is an expectation that in early March 2025, the price could find a solid floor at around 2200. This level will act as a springboard for potential upward price movement, giving investors hope of re-entering the market following the anticipated decline. This could present a compelling proposition for value investors looking to buy low in preparation for a subsequent upward trajectory. In the midst of these expected fluctuations, technical analysis will play a pivotal role in gauging the market sentiment. Analyzing the MACD (Moving Average Convergence Divergence) indicator reveals some critical insights—a DIF value of -166.4, a DEA value of -143.1, and a histogram value of -23.38 indicate a bearish trend overall. These metrics underline the importance of vigilance as we approach notable trading decisions. Despite the bearish sentiment reflected in these calculations, there exists the possibility of a short-term rebound. Investors should not only consider price but should also track any changes in trading volume and the position of the moving averages, as these factors can signal potential entry or exit points. In conclusion, the cryptocurrency market presents a unique challenge mixed with opportunity, especially for those prepared to navigate the impending volatility. While the forecast seems to indicate a rough patch in early 2025, understanding these patterns and indicators can equip investors and traders with the necessary tools to make informed decisions. With close monitoring of trading metrics, investors can place themselves strategically to benefit from the eventual upturns, turning challenges into profitable opportunities as the cryptocurrency landscape evolves.
Keywords
 Ethereum
2025-03-04
Blockenza Analysis
The analysis indicates a bearish trend for the cryptocurrency with potential for a slight short-term rebound. Overall, the expected decline suggests higher risk, leading to a score of -40.
FAQs
1. What is the expected price trend for this cryptocurrency from October to November 2024?
The cryptocurrency is expected to fluctuate upwards during that period.
2. When is the predicted decline for this cryptocurrency expected to start?
The decline is expected to begin from mid-December 2024.
3. What is the expected bottom for the price, and when will it occur?
The price is projected to reach a bottom in early February 2025.
4. What key resistance levels should be monitored?
Key resistance levels are around 3400, 3700, and 4000.
5. What are the identified support levels for this cryptocurrency?
Support levels are around 3200, 3000, 2800, and 2200.
6. When can we expect a potential rebound in the price?
A short-term rebound may occur in early March 2025.
7. What does the MACD indicator suggest about the trend?
The MACD indicator reflects a bearish trend overall.
8. What are the MACD indicator values presented?
The MACD values are: DIF -166.4, DEA -143.1, and histogram -23.38.
9. What should traders monitor closely according to the analysis?
Traders should monitor changes in trading volume and the moving average crossover situation.
10. What is the overall sentiment regarding the price trend?
The overall sentiment is bearish, but a short-term rebound opportunity exists.
Related Articles
In this section, you will find articles and analyses related to this post. These materials will help you gain more information about the topic and develop a broader perspective on the digital currency market. By reading these articles, you can make more informed and precise decisions in your investment journey.

Fundamental Analysis of Ethereum on March 11, 2025
The cryptocurrency market experienced notable volatility from October 2024 to March 2025, characterized by a breakout pattern leading to an initial bullish trend before a sharp downturn occurred. Despite warnings indicated by technical indicators of bearish momentum, recent developments suggest caution as market participants monitor trading volumes and support levels for potential recovery opportunities.
Ethereum
2025-03-11

A Whale Purchased 15,292 ETH for an Average Price of $2014
A whale purchased 15,292 ETH for an average price of $2014 about ten hours ago, currently facing an unrealized loss of $2.2 million due to market fluctuations. This scenario underscores the volatility and risk associated with investing in cryptocurrencies.
Ethereum
2025-03-11

Promising Altcoins to Invest in for Your 2025 Portfolio: Web3Bay, Solana, XRP, Hedera, & Sui
As the cryptocurrency market enters a new growth phase, 2025 will likely highlight altcoins with high return potential. Investors are advised to explore a diverse range of altcoins beyond Bitcoin and Ethereum for promising investment opportunities.
Ethereum
2025-03-11

Ethereum's Decline: A Significant Drop Amid Market Challenges
Ethereum has fallen to $1,809, experiencing an 8% decline over the last day, with the BTC/ETH ratio dropping below 0.24 for the first time since February 2020. The cryptocurrency market remains volatile as investors keep a watchful eye on these developments.
Ethereum
2025-03-11

Unstoppable Crypto Access: Coinbase Launches Revolutionary 24/7 Bitcoin and Ethereum Futures
Coinbase has announced the launch of 24/7 Bitcoin and Ethereum futures, revolutionizing market access for U.S. traders. This groundbreaking move enables traders to engage with cryptocurrencies around the clock, attracting both seasoned and new investors.
Ethereum
2025-03-11
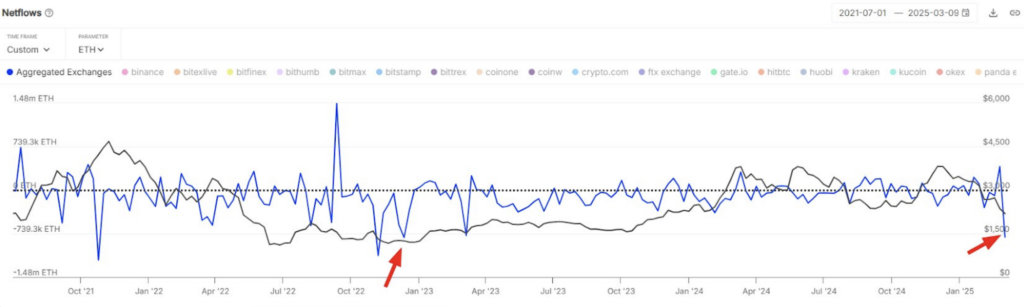
Ethereum Price Bottom? $1.8 Billion in ETH Outflow Fuels Market Speculation
Ethereum (ETH) saw its largest weekly exchange outflow of $1.8 billion since December 2022, suggesting accumulation among investors despite ongoing bearish sentiment. However, technical indicators indicate a critical resistance level that needs to be reclaimed for a confirmed price bottom.
Ethereum
2025-03-11