
Technical Analysis of Ripple as of March 11, 2025
The asset is currently experiencing a downward oscillating trend following an upward movement from mid-October to mid-November 2024. Key resistance levels are identified, and breaking above them could indicate an upward trend, while falling below support levels may suggest further declines.
Article
The asset under analysis is presently experiencing a downward oscillation trend that has sparked considerable interest among traders and investors alike. Understanding the nuances of its recent performance is essential for making informed decisions regarding future trades. This asset exhibited notable upward momentum from mid-October to mid-November 2024, but the subsequent developments and technical indicators signal a potential shift in direction. From a technical perspective, the formation of price activity from mid-October suggests that bullish sentiment was strong enough to drive the asset higher during this period. However, the long upper shadow observed on November 16, 2024, has raised concerns about the sustainability of this upward movement. Such a shadow often indicates indecision among market participants, implying that while buyers attempted to push the price up, sellers stepped in to curtail further advances. This could signify a weakening of momentum, prompting traders to reconsider their positions. Key resistance levels have been established at critical price points: 1.1200 observed on November 17, 2024, 1.4700 on November 22, 2024, and 1.9500 on December 1, 2024. The significance of these levels cannot be overstated; they reflect zones where selling pressure has historically intensified, thereby posing a challenge for the asset to maintain an upward trajectory. Should the price manage to break through the resistance at 2.400, it could serve as a precursor for an upward trend, enticing investors back into the market and potentially igniting fresh buying interest. Conversely, it is equally essential to monitor the support levels that have emerged over recent months. The key support zones are pegged at 2.000 on March 10, 2025, 2.100 on January 29, 2025, and 2.300 on February 6, 2025. A breach below the 2.000 support level could signal significant bearish momentum, compelling traders to react immediately to reposition their exposure and mitigate potential losses. This could foster further decline in the asset's value, exacerbating the ongoing downward oscillation trend. Traders should also pay close attention to changes in trading volume, which often serve as a leading indicator of potential price movement. A notable shift in volume can provide valuable insights into the strength of the current trend. The short-term moving average has shown a propensity to break above the long-term moving average; this crossover, together with the Differential Normalized (DIF) line crossing above the Directional Movement Indicator (DEA) line, could indicate the possibility of a short-term rebound. However, it is crucial to note that the anticipated strength of any rebound may be limited, suggesting that trading strategies should be executed with caution. In summary, the current landscape of this asset is characterized by its oscillatory behavior with upward and downward influences. While short-term traders might find opportunities to exploit these movements, longer-term investors must remain vigilant, understanding that market conditions remain fluid. The critical levels of resistance and support, trading volume, and the interaction of various technical indicators will play pivotal roles in determining the future trajectory of this asset. Being well-informed and adaptable in this environment is essential for maximizing the potential of trading this asset successfully.
Keywords
 Ripple
2025-03-11
Blockenza Analysis
The overall trend indicates potential for further decline, particularly if support levels do not hold.
FAQs
1. What trend is the asset currently in?
The asset is in a downward oscillating trend.
2. What does a long upper shadow indicate?
A long upper shadow suggests a weakening of momentum.
3. What are the key resistance levels?
Key resistance levels are around 1.1200, 1.4700, and 1.9500.
4. What are the strong support levels?
Strong support levels are around 2.000, 2.100, and 2.300.
5. What could happen if resistance around 2.400 is broken?
It may lead to an upward trend if the resistance is broken.
6. What does falling below the support level indicate?
Falling below the support level around 2.000 may suggest further decline.
7. Why is trading volume important?
Changes in trading volume can indicate potential price movement.
8. What does crossing above the DEA line indicate?
It may indicate a short-term rebound.
9. How strong is the potential short-term rebound?
The strength of the rebound is expected to be limited.
10. What time frame is the analysis based on?
The analysis is based on events taking place until March 11, 2025.
Related Articles
In this section, you will find articles and analyses related to this post. These materials will help you gain more information about the topic and develop a broader perspective on the digital currency market. By reading these articles, you can make more informed and precise decisions in your investment journey.
Pi Network (PI) Expected to Reach New High of $6.54: Here's When
Pi Network (PI) saw significant price increases earlier this year, peaking at $2.99. However, after experiencing a bullish breakout, the price has since dropped by 53.6%.
Ripple
2025-03-11

US Stablecoin Bill Receives Update Ahead of Senate Banking Committee Vote
The US Senate Banking Committee is scheduled to vote on the bipartisan GENIUS Act, focused on regulating stablecoins, on March 13. The bill aims to bring larger stablecoin issuers under Federal Reserve regulation, while enhancing consumer protections and imposing strict standards on foreign issuers.
Ripple
2025-03-11

Ripple's XRP Faces Bearish Pressure as TD Sequential Signals Weakness
TD Sequential indicators show bearish signals for XRP, with significant concerns about price stability. The presence of a head and shoulders pattern may lead XRP down to $1.50 if support breaks, while holding above $2 could potentially restore investor confidence.
Ripple
2025-03-11

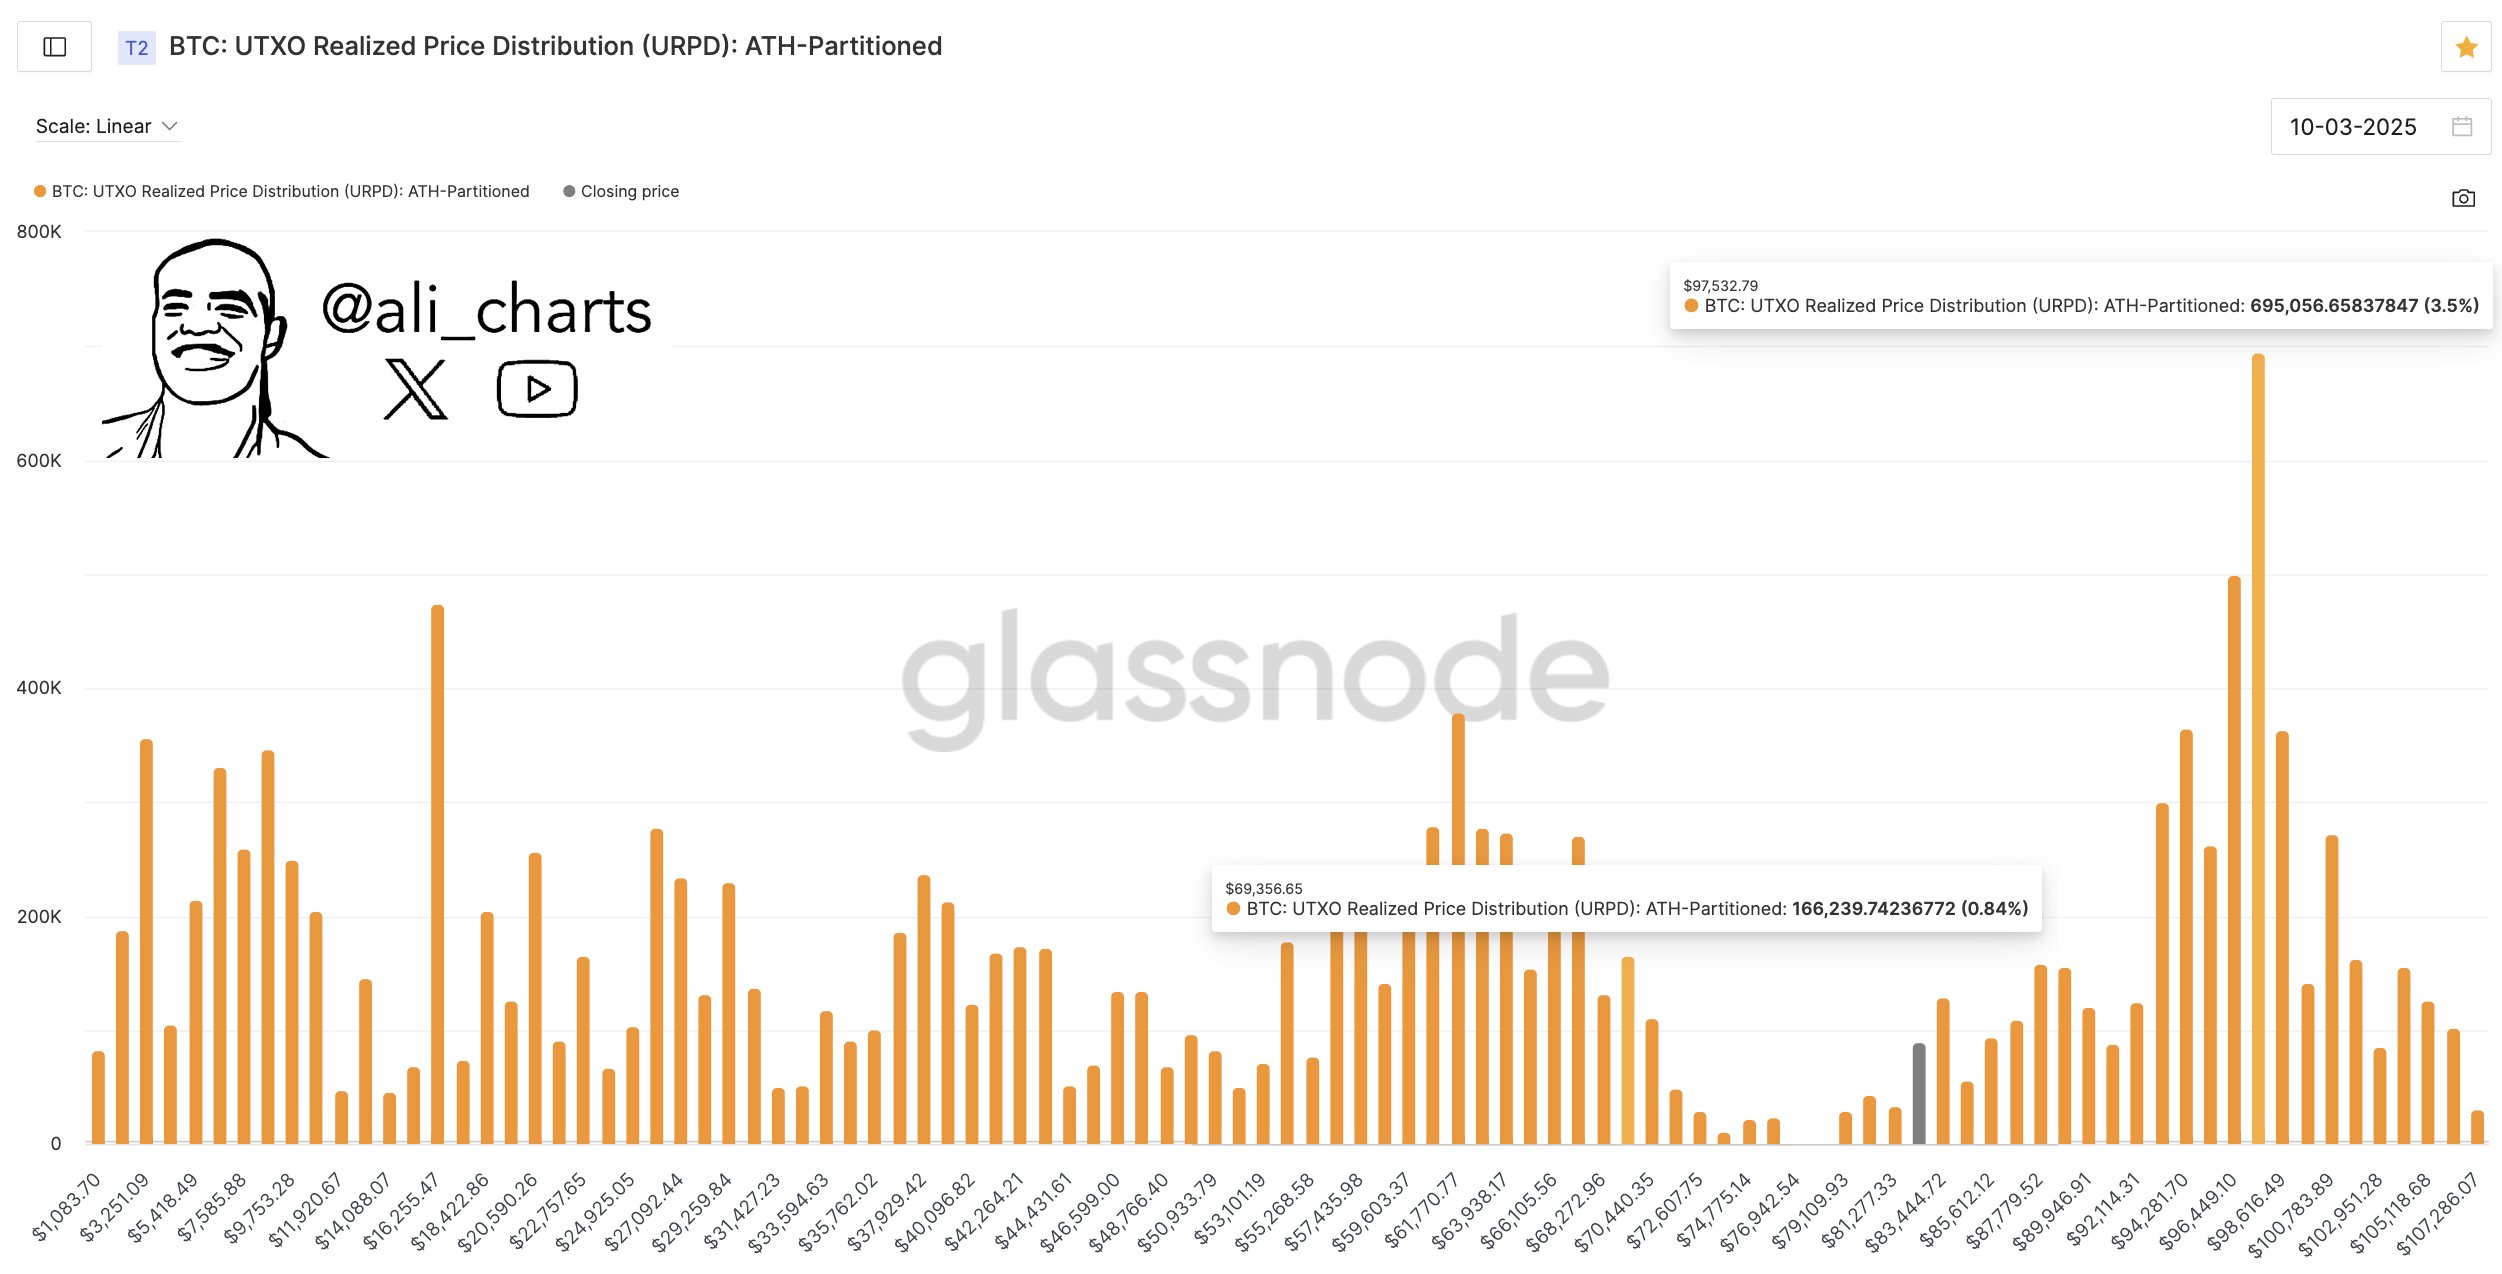
Bitcoin Price Correction Is Not Over Yet; Next Crucial Support Under $70,000
Bitcoin's price has dropped 3.10% under $80,000, and analysts expect further decline potentially below $70,000, worsened by Wall Street’s selloff. Altcoins are experiencing even greater drops, indicating a persistent bearish trend in the crypto market.
Ripple
2025-03-11
Bitcoin Price Correction Is Not Over Yet; Next Crucial Support Under $70,000
Bitcoin has dropped another 3.10%, falling under $80,000, with analysts predicting the price may fall below $70,000 before recovering. The crypto market is facing pressure amid significant sell-offs on Wall Street, leading to extended losses this week.
Ripple
2025-03-11

Grok AI and ChatGPT Predict Remittix Could Outperform XRP by 2027
Grok AI and ChatGPT forecast substantial increases in both XRP and Remittix, suggesting a significant market change is imminent. Experts predict that while Remittix could rise dramatically, XRP is also expected to reach new all-time highs by the second quarter of 2025.
Ripple
2025-03-11