
Technical Analysis of Ripple as of March 9, 2025
The cryptocurrency is in a downward trend with potential for a rebound if it breaks resistance at 2.7479. However, falling below 2.122 may lead to further declines, and caution is advised due to existing bearish indicators.
Article
**Current Market Analysis of Cryptocurrency Trends: A Focus on Potential Rebound Patterns** As the cryptocurrency market continues to experience fluctuations, one particular digital asset is currently undergoing a pronounced downward oscillation. This trend is evident from an analysis of its recent chart patterns, which reveal interesting signals that may indicate either a potential rebound or further declines. On March 2, 2025, the cryptocurrency in question exhibited a long lower shadow in its price chart. This specific pattern is often interpreted by traders as a bullish signal, suggesting that while the price dipped significantly during the trading session, it ultimately regained strength as investors turned more optimistic, pushing the price back up. Such candlestick formations are crucial as they can often foreshadow a reversal in trend, thus warranting the attention of both short- and long-term traders. The current market dynamics also highlight a critical resistance level standing at approximately 2.7479. This price point is significant because it marks a boundary between potential price advancement and further declines. If the cryptocurrency manages to breach this level convincingly, it may pave the way for a considerable upward movement, triggering renewed investor confidence and potentially leading to a rally. Conversely, however, should the price fall below the support level of 2.122, the digital asset could be poised for further downside exploration, posing additional risks for holders and traders alike. Furthermore, the trading volume patterns present an intriguing picture. On November 12, 2024 (UTC), there was a noticeable increase in trading volume, indicating an influx of capital into the market. A surge in trading activity often reflects increased interest and market participation, suggesting that investors were either taking positions or hedging against potential downturns. Yet, the recent trading volume has softened considerably, revealing a prevailing sentiment of caution among market participants. This low trading volume suggests that most investors are in a wait-and-see mode, carefully observing market developments before making further investment decisions. Adding to the cautious sentiment are the signals from the Moving Average Convergence Divergence (MACD) indicator. This trend-following momentum indicator continues to demonstrate bearish momentum, as both the short-term and long-term moving averages are aligned in a bearish formation. Such indicators reinforce the notion that traders should exercise caution in trying to "catch a falling knife," a trading strategy often fraught with risk when market directions remain clearly downward. In conclusion, the current analysis of this cryptocurrency highlights the necessity for traders to remain vigilant. The long lower shadow could present a signal of hope for a potential rebound, particularly if the price can successfully break above the critical resistance level while accompanied by an increase in trading volume. On the flip side, the looming support level suggests a need for careful monitoring, as falling below this threshold could unleash further selling pressure. Market participants should maintain a balanced approach, weighing the potential for gains against the risks of continued bearish momentum. In the dynamic world of cryptocurrencies, staying informed and agile is paramount for successfully navigating the ever-changing landscape of digital assets.
Keywords
 Ripple
2025-03-09
Blockenza Analysis
The analysis indicates a bearish trend with potential for some upward movement if resistance is broken; however, the current indicators suggest caution.
FAQs
1. What is the current trend of the cryptocurrency?
The cryptocurrency is in a downward oscillating trend.
2. What may indicate a potential rebound?
A long lower shadow appeared on March 2, 2025, which may indicate a potential rebound signal.
3. What is the key resistance level to watch?
The key resistance level is around 2.7479.
4. What happens if the price falls below 2.122?
If it falls below 2.122, it may explore further downside.
5. What did the significant trading volume on November 12, 2024, signify?
It indicated an influx of capital into the market.
6. What is the recent trading volume trend?
The recent trading volume has been relatively low, reflecting a wait-and-see sentiment.
7. What does the MACD indicator show?
The MACD indicator shows that bearish force still exists.
8. What should investors be cautious of?
Investors should be cautious against bottom-fishing.
9. What could signal a rebound trend?
Breaking the key resistance level with expanding trading volume could signal a rebound trend.
10. What should be monitored for potential price movement?
Investors should monitor the resistance level and trading volume fluctuations.
Related Articles
In this section, you will find articles and analyses related to this post. These materials will help you gain more information about the topic and develop a broader perspective on the digital currency market. By reading these articles, you can make more informed and precise decisions in your investment journey.

Pi Network (PI) Expected to Reach New High of $6.54: Here's When
Pi Network (PI) saw significant price increases earlier this year, peaking at $2.99. However, after experiencing a bullish breakout, the price has since dropped by 53.6%.
Ripple
2025-03-11

US Stablecoin Bill Receives Update Ahead of Senate Banking Committee Vote
The US Senate Banking Committee is scheduled to vote on the bipartisan GENIUS Act, focused on regulating stablecoins, on March 13. The bill aims to bring larger stablecoin issuers under Federal Reserve regulation, while enhancing consumer protections and imposing strict standards on foreign issuers.
Ripple
2025-03-11

Ripple's XRP Faces Bearish Pressure as TD Sequential Signals Weakness
TD Sequential indicators show bearish signals for XRP, with significant concerns about price stability. The presence of a head and shoulders pattern may lead XRP down to $1.50 if support breaks, while holding above $2 could potentially restore investor confidence.
Ripple
2025-03-11
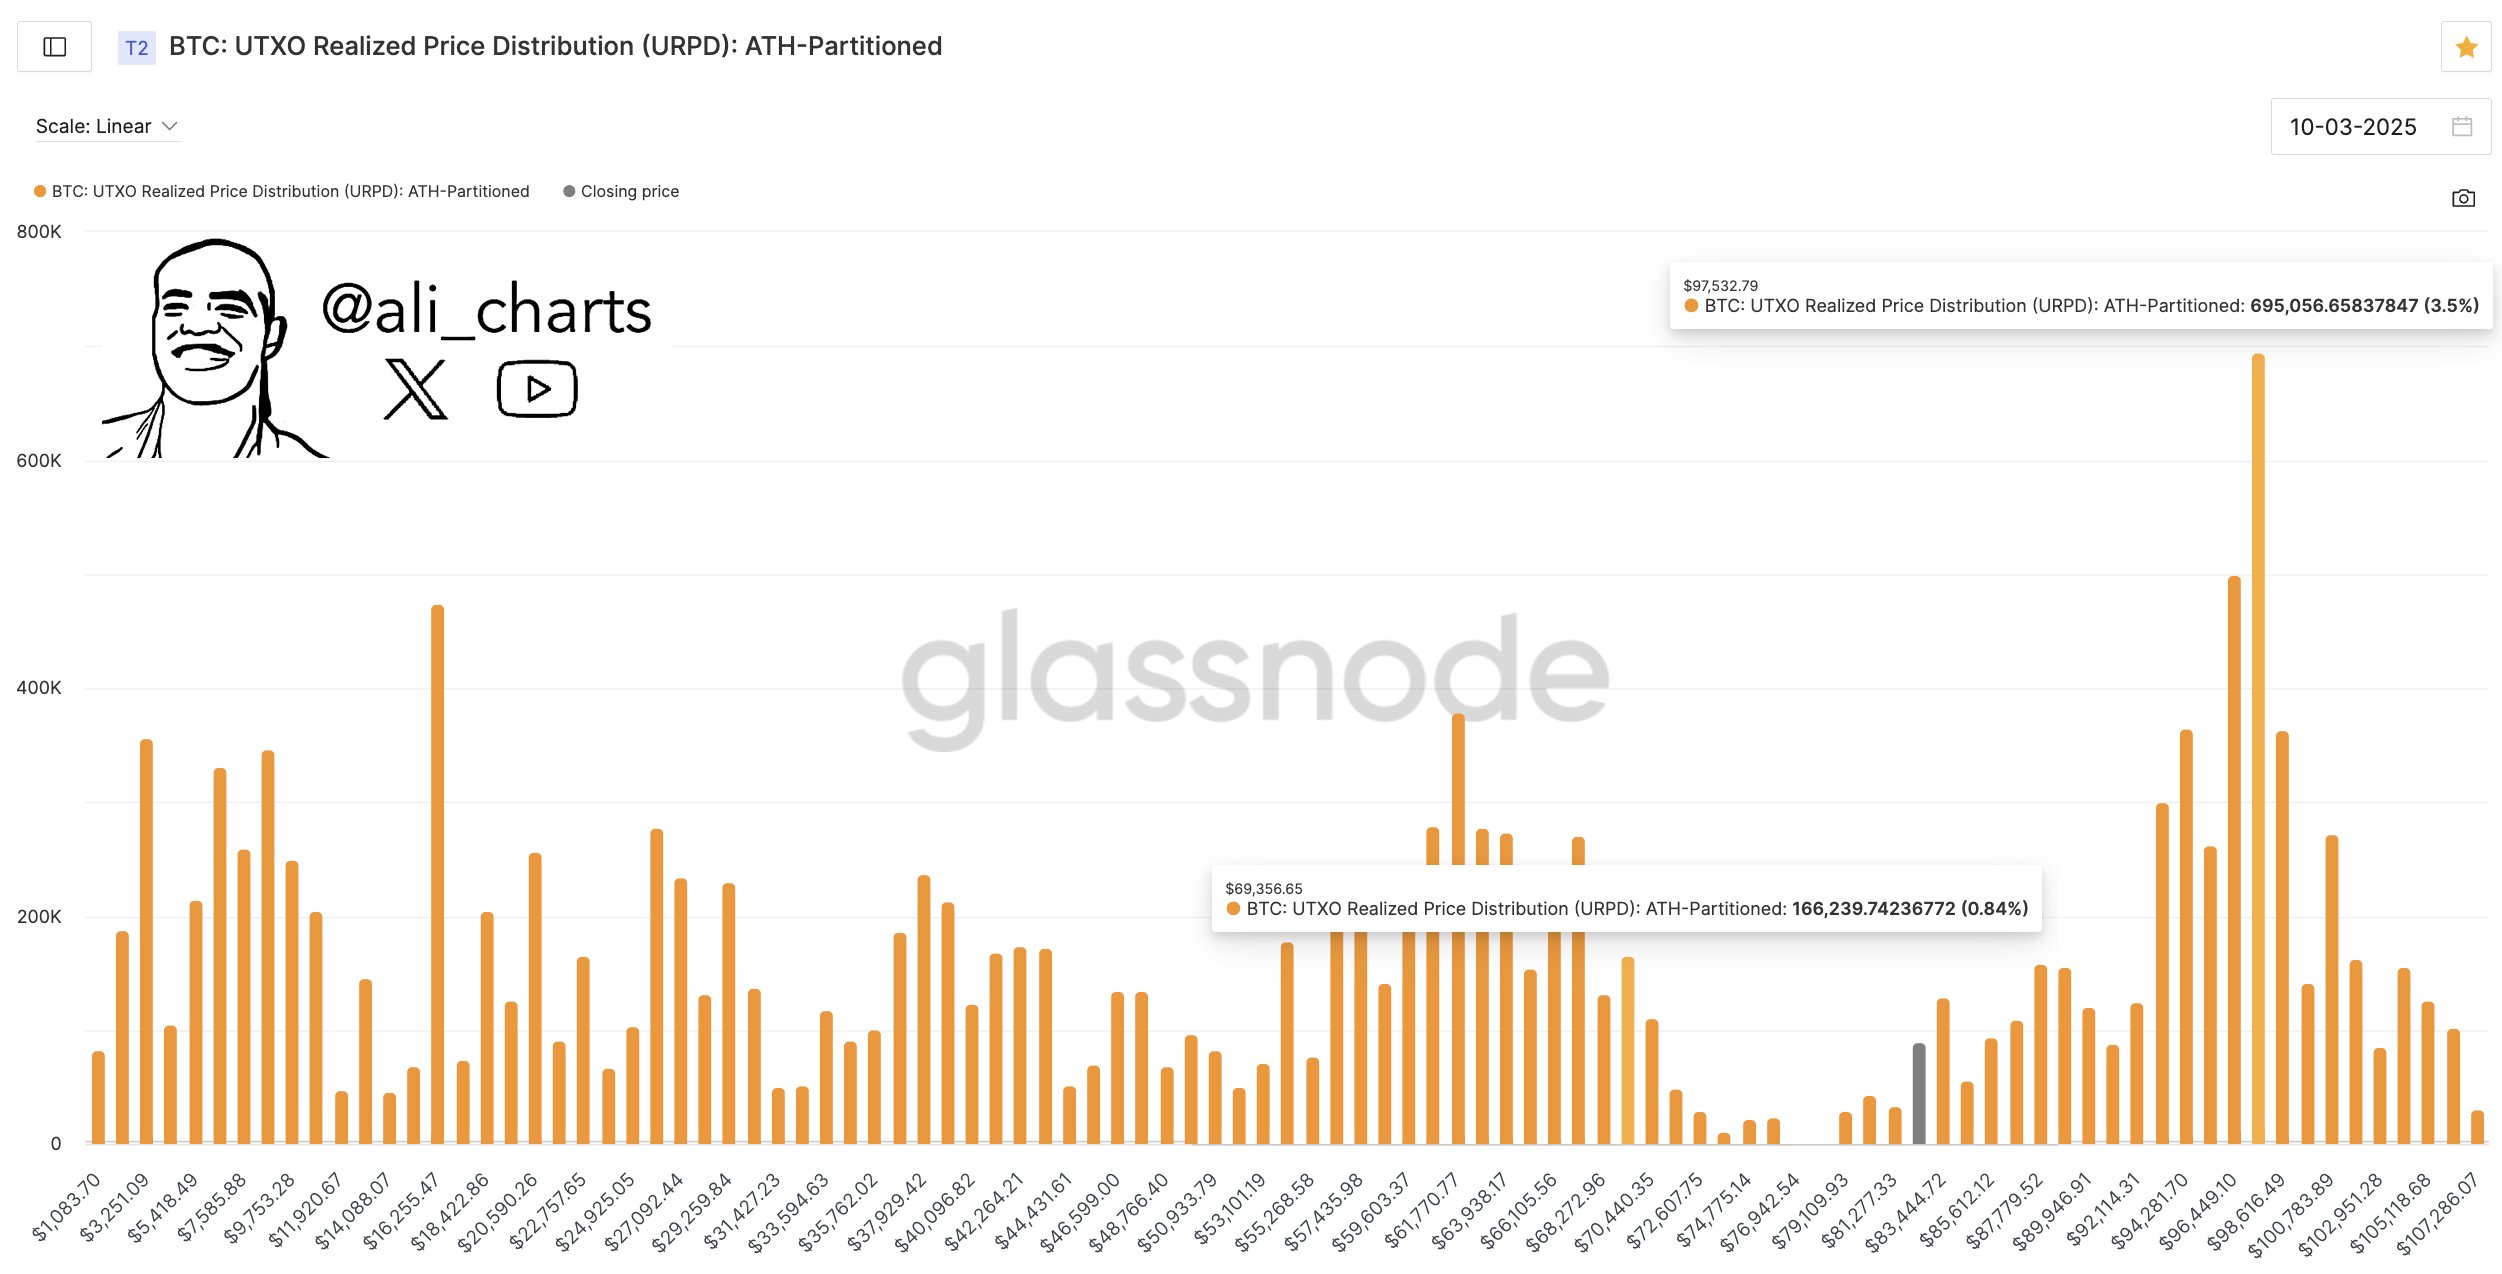
Bitcoin Price Correction Is Not Over Yet; Next Crucial Support Under $70,000
Bitcoin's price has dropped 3.10% under $80,000, and analysts expect further decline potentially below $70,000, worsened by Wall Street’s selloff. Altcoins are experiencing even greater drops, indicating a persistent bearish trend in the crypto market.
Ripple
2025-03-11
Bitcoin Price Correction Is Not Over Yet; Next Crucial Support Under $70,000
Bitcoin has dropped another 3.10%, falling under $80,000, with analysts predicting the price may fall below $70,000 before recovering. The crypto market is facing pressure amid significant sell-offs on Wall Street, leading to extended losses this week.
Ripple
2025-03-11

Grok AI and ChatGPT Predict Remittix Could Outperform XRP by 2027
Grok AI and ChatGPT forecast substantial increases in both XRP and Remittix, suggesting a significant market change is imminent. Experts predict that while Remittix could rise dramatically, XRP is also expected to reach new all-time highs by the second quarter of 2025.
Ripple
2025-03-11