
Fundamental Analysis of Chainlink on March 10, 2025
The cryptocurrency market from October 2024 to March 2025 showed notable price volatility characterized by a significant price surge followed by corrections and a marked decline, influenced by various technical and fundamental factors. Investors should remain vigilant and employ strategic risk management to navigate identified support and resistance levels amidst prevailing bearish sentiment.
Article
Between October 2024 and March 2025, the cryptocurrency market went through an intense period characterized by considerable volatility, marked by substantial price surges, corrections, and significant declines. This timeframe was intriguing for traders and investors alike due to the interplay of numerous technical and fundamental factors shaping market behavior. The rise of interest in cryptocurrencies during this period can be traced back to October 2024 when this particular asset class saw an extraordinary increase in value. Retail and institutional investors jumped at the chance to capitalize on the bullish trends, spurred by the increasing adoption of cryptocurrencies and advancements in blockchain technology, all while buoyed by optimistic developments in the wider financial markets. This bullish sentiment fostered an avalanche of investments, painting an optimistic picture for the crypto landscape. However, as the spike persisted and the price climbed closer to mid-November 2024, signs of a weakening upward momentum began to surface. This trend led to the identification of a 'death cross' in mid-January 2025, a technical indicator that sent warning signals to potential investors. In market terminology, a death cross occurs when the short-term moving average of an asset dips below its long-term moving average, which is generally interpreted as a bearish signal. This pattern fundamentally shifts market sentiment, leading many to question the sustainability of the previously achieved price highs. By February 10, 2025, market analysts pointed out key resistance levels around $19.12. Resistance levels serve a critical role in technical analysis, denoting price points where the selling pressure may exceed buying interest, thus leading to potential stagnation or reversal in price trends. If prices were to break through this resistance, it could potentially reignite investors' optimism, hinting at a chance for further price elevation. On the other hand, a crucial support level established around $14.01, observed on February 25, 2025, posed a threat to a significant downturn should the price fall below this threshold. A breach here could catalyze a selling frenzy and exacerbate the bearish sentiment gripping the market. Throughout this volatile period, trading volume emerged as a focal point. High trading volume typically reflects strong market sentiment and robust competition between bullish and bearish investors. Fluctuations in trading volume affected market dynamics, as participants adjusted their strategies based on varying technical signals and economic conditions. Observing these movements and aligning them with sound technical analysis became imperative for prospective investors. From a technical perspective, the moving averages showcased a bearish alignment, confirming the downward trajectory that several indicators were painting. The Moving Average Convergence Divergence (MACD), a widely respected technical tool, further reinforced this negative outlook. The MACD values indicated that both the difference between short-term and long-term moving averages and the signal line were situated below the zero mark, suggesting intensifying downward pressure. This warranted caution among traders and highlighted the potential risks involved in market maneuvers during this particular cycle. It is essential for investors to remain vigilant and closely monitor these evolving price patterns, especially as they interact with crucial support and resistance levels to identify strategic trading opportunities. Implementing adequate risk management strategies, such as setting stop-loss orders and maintaining a diversified portfolio, can provide a safety net against sudden market declines. In summary, the time frame from October 2024 to March 2025 in the cryptocurrency market offers an insightful glimpse into the complex nature of market dynamics influenced by both technical indicators and shifting investor sentiment. As the cryptocurrency landscape continues to evolve, having a comprehensive understanding of price movements and the implications of resistance and support can greatly enhance investment decision-making. This period serves as a powerful reminder of the necessity for strategic foresight and rigorous market analysis in a field that is both opportunistic and rife with risks. The journey through these months can underscore an essential lesson: adaptability, vigilance, and informed decision-making are indispensable tools for navigating the unpredictable world of cryptocurrencies.
Keywords
 Chainlink
2025-03-10
Blockenza Analysis
The analysis indicates a bearish trend in the cryptocurrency market, with expected further declines based on the observed technical indicators and resistance levels, leading to a score of -75.
FAQs
1. What is a death cross?
A death cross occurs when the short-term moving average crosses below the long-term moving average, signaling a potential bearish trend.
2. What was a key resistance level identified in February 2025?
A significant resistance level was noted at around 19.12.
3. What does high trading volume indicate?
High trading volume often suggests strong market interest and competition between buyers and sellers.
4. What may happen if prices breach crucial support levels?
A breach below support levels could lead to increased selling pressure and a bearish trend.
5. How does the Moving Average Convergence Divergence (MACD) affect market outlook?
The MACD shows market momentum; a negative MACD suggests bearish sentiment and potential downward trends.
6. What are key resistance points mentioned in the analysis?
Key resistance levels include $27.41, $30.89, and $26.90.
7. What did the candlestick patterns signify in December 2024?
A long upper wick indicated substantial selling pressure, implying resistance against further price increases.
8. What is the importance of resistance levels?
Resistance levels indicate price points where selling interest may overpower buying interest, which can lead to price stagnation.
9. What is the significance of monitoring trading volume?
Fluctuations in trading volume can provide vital insights into market sentiment and potential price reversals.
10. What is essential for investors amid market volatility?
Strategic risk management, including stop-loss orders and portfolio diversification, is crucial for navigating volatile markets.
Related Articles
In this section, you will find articles and analyses related to this post. These materials will help you gain more information about the topic and develop a broader perspective on the digital currency market. By reading these articles, you can make more informed and precise decisions in your investment journey.

Missed Out on Chainlink? Discover Why Qubetics is the Crypto Coin to Invest in 2025
The cryptocurrency market is evolving rapidly in 2025, offering new investment opportunities. Qubetics is gaining attention as a promising alternative to established names like Bitcoin and Ethereum.
Chainlink
2025-03-11
Astra Nova’s Rapid Rise: $3.5M Funded, Over 210K Gamers Engaged, and a $45 Million Valuation Sparks TGE Excitement
Astra Nova is a dynamic player in the Web3 gaming space, having raised $3.5 million and engaged over 210,000 gamers, leading to a $45 million valuation. Their innovative Black Pass Questing Platform and strategic partnerships signal significant potential in the gaming industry.
Chainlink
2025-03-11

BlockDAG and SpaceDev Partnerships: Navigating Challenges for Solana and Dogecoin
Strong alliances are crucial for the success of blockchain projects, with Solana and Dogecoin facing distinct challenges in the market. While Solana grapples with volatility and Dogecoin suffers from a lack of utility, BlockDAG is effectively enhancing its position through strategic partnerships.
Chainlink
2025-03-11
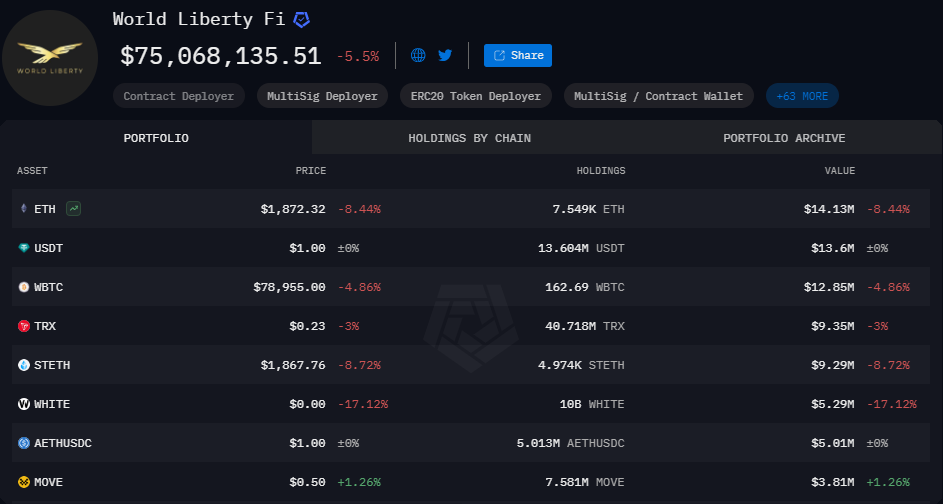
World Liberty Financial Nears Completion of WLFI Tokens Presale
World Liberty Financial is close to finalizing the presale of WLFI tokens, needing only $2 million to proceed to the next stage. The presale has garnered significant interest and is on track for completion, despite potential external market fluctuations.
Chainlink
2025-03-11

Stablecoins Market Capitalization Reaches Historic High of $204.7 Billion
The market capitalization of the top five stablecoins has reached an all-time high of $204.7 billion, indicating a significant shift by investors towards safer, cash-like instruments amidst market uncertainty. This trend reflects a growing aversion to riskier assets and highlights the increasing reliance on stablecoins.
Chainlink
2025-03-11

Chainlink Anticipates Market Recovery with $350 Trillion Opportunity
Sergey Nazarov, Chainlink's founder, predicts a $350 trillion market value for blockchain integration in traditional finance, with significant collaboration efforts in place. Despite a price drop since late 2022, Chainlink's long-term potential remains strong due to partnerships with institutions and government interest in its technology.
Chainlink
2025-03-11