
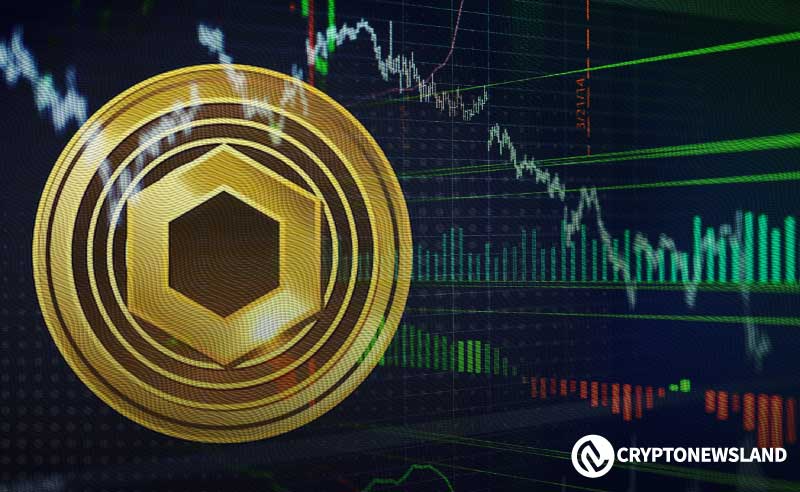
Fundamental Analysis of Chainlink on March 5, 2025
The financial market exhibited a bullish trend from early October to early December 2024 but turned bearish by mid-December, with worries about instability heightened by key resistance and support levels. The cryptocurrency market is expected to experience volatility in early 2025, further exhibiting key support and resistance levels that could influence trading decisions amid fluctuating investor sentiment.
Article
From early October to early December 2024, the financial market witnessed a striking and optimistic trend characterized by a consistent upward trajectory. This period, marked by an influx of investor confidence across various asset classes, fostered a robust bullish sentiment, pushing many stocks and cryptocurrencies to new highs. The initial weeks of this phase saw rampant optimism among investors, driven by favorable economic indicators, increasing market demand, and significant technological advancements. However, this optimistic path deviated sharply around mid-December 2024 when the market began to shift gears. Concerns began to mount, prompting traders and analysts to reassess their positions and strategies. A critical signal of this change occurred on December 2, when a notable bullish candle was formed, indicating strong buying pressure typically associated with a bullish market. Nevertheless, the paradox emerged when the market failed to capitalize on this bullish momentum, leading to a corrective phase that introduced heightened volatility. During this adjustment phase, market participants adopted a more reactive approach, emphasizing caution over aggressive investment. Important resistance levels emerged at 26.90 and 30.89, while support levels were established at 14.01 and 13.47. Understanding these benchmarks became essential, as they indicated where buying interest could resurface or where selling pressure might intensify. Resistance levels signify where upward movement generally slows, while support levels provide a cushion against declining prices. Maintaining a position above these support levels was crucial, as falling below them could forecast a further downturn in market sentiment. The situation became particularly precarious on February 24, 2025, when the market registered a pronounced bearish candle, breaking through the significant 18.00 support level. This breach was not merely a technical failure; rather, it signaled a complete transition of the previously supportive environment into one marked by skepticism. Investors now faced a daunting reality—the 18.00 level transformed into a new resistance, indicating a deeper plunge into bearish sentiment and potentially triggering panic-driven selling behaviors among traders. December 2, also notable for recording an impressive peak trading volume of 600,000 units, demonstrated a significant level of market participation. High trading volumes often authenticate the strength of prevailing trends, prompting many traders to aim for profitable trades during the bullish anomaly. However, the subsequent downturn ignited debates regarding the sustainability of the prevailing bullish trend and the inherent risks associated with trading in such unpredictable climates. Convincingly, the Moving Average Convergence Divergence (MACD) indicator supported a bearish outlook, with both the Differencing (DIF) and the Exponential Moving Average (DEA) lines situated below the zero line. Such readings typically signal further downward momentum, urging traders to make informed decisions that mitigate potential losses. As the market navigated these fluctuations, the necessity for strategic decision-making became paramount. This imperative necessitated traders to maintain vigilance, especially as any unraveling of support levels could enhance current declines further. Overall, the dynamic nature of the financial landscape from October to the early months of 2025 not only illustrated the interplay of bullish and bearish forces but highlighted the intrinsic volatility that surrounds financial markets. In summary, as investors and traders move forward, they must remain acutely aware of fluctuating sentiments and robust technical indicators. For those engaged in cryptocurrencies, which are known for their extreme volatility, this confluence of insight can be critical for developing risk management strategies and responding adeptly to the imminent changes in market conditions. The necessity for ongoing reassessment and adjustments to investment portfolios cannot be overstated, as participants aim for success amid this ever-evolving financial landscape.
Keywords
 Chainlink
2025-03-05
Blockenza Analysis
Market indicators suggest a continuing bearish trend influenced by recent price breaches and declining sentiment, indicating a higher likelihood of price declines in the near term.
FAQs
1. What was the trend in the financial market from October to December 2024?
The trend was characterized by an unwavering upward movement with strong bullish sentiment.
2. When did the market's optimistic trajectory change?
The market began to decline around mid-December 2024.
3. What is a bullish candle?
A bullish candle indicates strong buying pressure in the market.
4. What are critical resistance and support levels?
Resistance levels are points where selling pressure is expected; support levels are points where buying interest may occur.
5. What happened to the support level around 18.00 on February 24, 2025?
A bearish candle breached this level, transforming it into new resistance.
6. Why is trading volume significant?
High trading volume indicates the strength of a market trend.
7. What does the Moving Average Convergence Divergence (MACD) indicator suggest?
Current MACD readings suggest a bearish signal, indicating possible further declines.
8. What should traders be cautious of looking ahead?
They should be wary of key support levels that could be breached, leading to further market declines.
9. What is a bearish market sentiment?
A bearish market sentiment indicates widespread pessimism among investors regarding the future market performance.
10. What is vital for investors in this market?
Strategic decision-making based on technical indicators is crucial for navigating the market.
Related Articles
In this section, you will find articles and analyses related to this post. These materials will help you gain more information about the topic and develop a broader perspective on the digital currency market. By reading these articles, you can make more informed and precise decisions in your investment journey.

Missed Out on Chainlink? Discover Why Qubetics is the Crypto Coin to Invest in 2025
The cryptocurrency market is evolving rapidly in 2025, offering new investment opportunities. Qubetics is gaining attention as a promising alternative to established names like Bitcoin and Ethereum.
Chainlink
2025-03-11
Astra Nova’s Rapid Rise: $3.5M Funded, Over 210K Gamers Engaged, and a $45 Million Valuation Sparks TGE Excitement
Astra Nova is a dynamic player in the Web3 gaming space, having raised $3.5 million and engaged over 210,000 gamers, leading to a $45 million valuation. Their innovative Black Pass Questing Platform and strategic partnerships signal significant potential in the gaming industry.
Chainlink
2025-03-11

BlockDAG and SpaceDev Partnerships: Navigating Challenges for Solana and Dogecoin
Strong alliances are crucial for the success of blockchain projects, with Solana and Dogecoin facing distinct challenges in the market. While Solana grapples with volatility and Dogecoin suffers from a lack of utility, BlockDAG is effectively enhancing its position through strategic partnerships.
Chainlink
2025-03-11
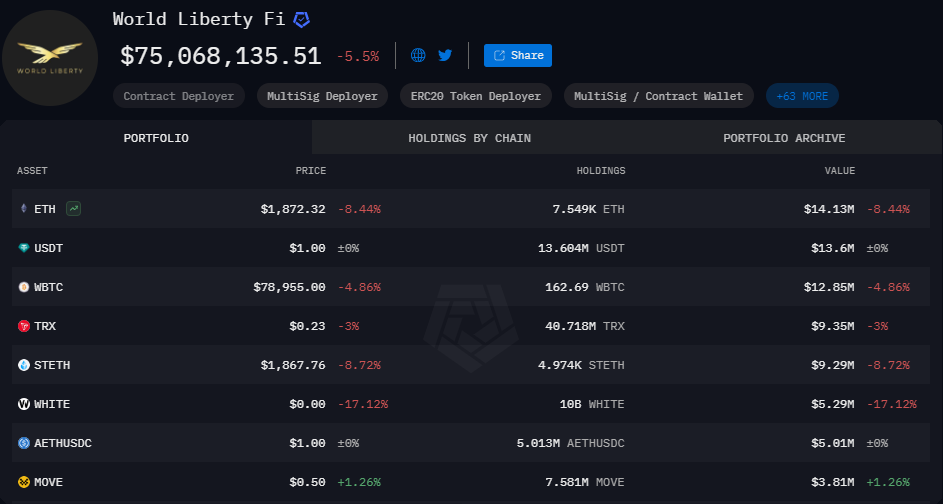
World Liberty Financial Nears Completion of WLFI Tokens Presale
World Liberty Financial is close to finalizing the presale of WLFI tokens, needing only $2 million to proceed to the next stage. The presale has garnered significant interest and is on track for completion, despite potential external market fluctuations.
Chainlink
2025-03-11
Stablecoins Market Capitalization Reaches Historic High of $204.7 Billion
The market capitalization of the top five stablecoins has reached an all-time high of $204.7 billion, indicating a significant shift by investors towards safer, cash-like instruments amidst market uncertainty. This trend reflects a growing aversion to riskier assets and highlights the increasing reliance on stablecoins.
Chainlink
2025-03-11
Chainlink Anticipates Market Recovery with $350 Trillion Opportunity
Sergey Nazarov, Chainlink's founder, predicts a $350 trillion market value for blockchain integration in traditional finance, with significant collaboration efforts in place. Despite a price drop since late 2022, Chainlink's long-term potential remains strong due to partnerships with institutions and government interest in its technology.
Chainlink
2025-03-11