
Fundamental Analysis of Chainlink on March 8, 2025
Between October 2024 and March 2025, financial markets experienced notable fluctuations, including a marked decline that prompted necessary adjustments. Technical indicators such as resistance levels and trading volumes signalize critical market conditions, urging cautious investment strategies amidst the prevailing bearish sentiment.
Article
From October 2024 to March 2025, the landscape of financial markets transformed dramatically, characterized by a complex interplay of fluctuations marked by volatility, both upward and downward trends, ultimately leading to a noteworthy decline. This six-month period served as a critical reminder for many investors about the necessity for rigorous market adjustments and strategic planning. A thorough examination of chart patterns allows for a comprehensive understanding of market dynamics, ultimately contributing to more informed investment decisions. One of the pivotal moments during this timeframe occurred on December 2, 2024, noted for its pronounced long upper wick, often indicative of substantial selling pressure. This candlestick phenomenon demonstrated that while prices initially surged, they faced considerable resistance, causing the market to retract. Such behavior frequently leads to notable shifts in market sentiment, signaling a potential decrease in investor confidence. It prompts traders to reevaluate their positions, considering whether to hold, sell, or wait for further clarity before making decisions. Subsequent analysis from late February 2025 brought forth another crucial observation. An engulfing pattern manifested on February 24 and 25, signifying a powerful reversal signal. This technical formation occurs when a smaller candlestick is overshadowed by a larger one, completely engulfing the previous candle, thus underscoring the burgeoning bearish sentiment prevailing in the market. Such indicators sketch a picture of sellers gaining dominance as traders wrestle with potential uncertainties, highlighting a pronounced need for cautious investment strategies in the face of shifting tides. In addition to observing candlestick patterns, determining resistance and support levels is essential for traders attempting to navigate the tumultuous market conditions effectively. During this analysis, resistance levels were pinpointed at 26.90 and 19.86, signifying price points where selling pressure could significantly intensify, hampering further upward price movements. Conversely, substantial levels of support were identified at 14.01 and 13.09, where buyers might reenter the market to prevent prices from dwindling further. This knowledge equips investors to craft informed trading strategies, ideally placing buy orders near support levels and sell orders near resistance levels. Compounding these dynamics, trading volume reached a remarkable peak of 601,807 units on December 2, 2024, signifying heightened market activity and offering insights into investor behavior. Such peaks in trading volume often coincide with shifts in market sentiment and may foreshadow critical turning points in trends. For traders, understanding the fluctuations in trading volume is paramount, as it can frequently precede significant price movements. The Moving Average Convergence Divergence (MACD) indicator further adds layers to the interpretation of market conditions. Throughout this period, MACD provided signals that while bearish sentiment dominated, some signs suggested weakening momentum, hinting at a possible market rebound. Investors should approach such prospects with caution, remaining mindful of medium-term forecasts that indicate possible additional downward pressure. In summary, the period from October 2024 to March 2025 featured turbulent market movements, demanding careful analysis and strategic vigilance from investors. The presented insights into analyzing support and resistance levels, monitoring trading volumes, and evaluating technical indicators are crucial tools for navigating uncertain financial waters. Ultimately, markets represent a complex interplay of sentiment and data, demanding ongoing diligence and adaptability among market participants. In times of fluctuation, preparedness can position investors to seize potential opportunities while adeptly mitigating associated risks, emphasizing the essential nature of informed strategy in the ever-evolving landscape of financial markets.
Keywords
 Chainlink
2025-03-08
Blockenza Analysis
Based on the prevailing bearish sentiment and market dynamics, it is likely that prices will continue to experience downward pressure in the near term.
FAQs
1. What period does this analysis cover?
The analysis covers the period from October 2024 to March 2025.
2. What major market trend was observed?
A significant downward trajectory was observed, with periods of volatility and attempts at recovery.
3. What are resistance levels?
Resistance levels are price points where selling pressure may increase, hindering upward price movements.
4. What are the notable dates discussed?
The notable dates include December 2, 2024, and February 24-25, 2025.
5. What does the MACD indicator indicate?
The MACD indicates prevailing bearish sentiment with signs of weakening momentum, suggesting a potential rebound.
6. What is the significance of trading volume?
Trading volume is a strong indicator of market activity and can reflect investor interest at crucial moments.
7. What should investors monitor during volatile periods?
Investors should monitor support and resistance levels, trading volumes, and technical indicators like MACD.
8. What does a 'death cross' signify?
A 'death cross' indicates a bearish trend when a short-term moving average crosses below a long-term moving average.
9. What is the recommended approach to investment during this period?
Cautious investment strategies are recommended, focusing on monitoring market conditions closely.
10. What long-term trends are anticipated based on this analysis?
The analysis suggests expected short-term declines with the potential for market stabilization or reversal signals.
Related Articles
In this section, you will find articles and analyses related to this post. These materials will help you gain more information about the topic and develop a broader perspective on the digital currency market. By reading these articles, you can make more informed and precise decisions in your investment journey.

Missed Out on Chainlink? Discover Why Qubetics is the Crypto Coin to Invest in 2025
The cryptocurrency market is evolving rapidly in 2025, offering new investment opportunities. Qubetics is gaining attention as a promising alternative to established names like Bitcoin and Ethereum.
Chainlink
2025-03-11
Astra Nova’s Rapid Rise: $3.5M Funded, Over 210K Gamers Engaged, and a $45 Million Valuation Sparks TGE Excitement
Astra Nova is a dynamic player in the Web3 gaming space, having raised $3.5 million and engaged over 210,000 gamers, leading to a $45 million valuation. Their innovative Black Pass Questing Platform and strategic partnerships signal significant potential in the gaming industry.
Chainlink
2025-03-11

BlockDAG and SpaceDev Partnerships: Navigating Challenges for Solana and Dogecoin
Strong alliances are crucial for the success of blockchain projects, with Solana and Dogecoin facing distinct challenges in the market. While Solana grapples with volatility and Dogecoin suffers from a lack of utility, BlockDAG is effectively enhancing its position through strategic partnerships.
Chainlink
2025-03-11
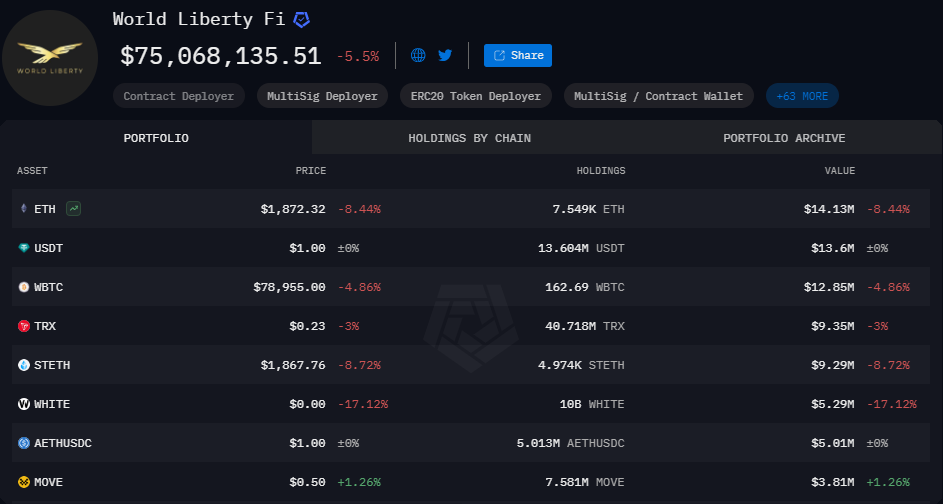
World Liberty Financial Nears Completion of WLFI Tokens Presale
World Liberty Financial is close to finalizing the presale of WLFI tokens, needing only $2 million to proceed to the next stage. The presale has garnered significant interest and is on track for completion, despite potential external market fluctuations.
Chainlink
2025-03-11

Stablecoins Market Capitalization Reaches Historic High of $204.7 Billion
The market capitalization of the top five stablecoins has reached an all-time high of $204.7 billion, indicating a significant shift by investors towards safer, cash-like instruments amidst market uncertainty. This trend reflects a growing aversion to riskier assets and highlights the increasing reliance on stablecoins.
Chainlink
2025-03-11

Chainlink Anticipates Market Recovery with $350 Trillion Opportunity
Sergey Nazarov, Chainlink's founder, predicts a $350 trillion market value for blockchain integration in traditional finance, with significant collaboration efforts in place. Despite a price drop since late 2022, Chainlink's long-term potential remains strong due to partnerships with institutions and government interest in its technology.
Chainlink
2025-03-11