
Technical Analysis of Chainlink as of February 27, 2025
The market trend is downward with prices around 15.246, facing critical support at 15.275. Despite bearish indicators, some signs suggest potential stabilization may occur before positioning decisions.
Article
**Market Analysis: Current Trends and Future Projections** As we move further into 2025, the market has shown a noticeable downward trend, currently stabilizing at approximately 15.246 yuan. This decline has raised concerns among investors and analysts alike, prompting a closer examination of recent technical patterns that could provide insight into future movements. Noteworthy developments have emerged, particularly a significant breakout to 26 yuan in mid-November 2024. This surge was short-lived, however, as the market soon encountered resistance, resulting in a double top pattern forming in the 26-27 yuan range by early December. Double tops typically signal a market reversal, suggesting that a prolonged upward push might be coming to an end as sellers gain strength. In January 2025, the situation evolved further with the identification of a W-bottom pattern in the critical 19-20 yuan range, indicating a potential area of support where the price could stabilize and possibly reverse its current trajectory. The critical support level, currently established at 15.275, is a vital focal point for market participants. A breach below this level could reignite bearish sentiment, resulting in additional downward pressure and possibly leading prices even lower. Traders and investors should be particularly alert to this support as it represents a threshold that could significantly alter market dynamics if crossed. Further reinforcing the bearish outlook, moving averages have confirmed a downward trend, and the Moving Average Convergence Divergence (MACD) indicator reveals that all three components remain in negative territory, with the values showing DIF at -1.439 and DEA at -1.226. The MACD is widely respected for its ability to provide early signals of trend reversals and momentum shifts, and as such, the current readings imply that bearish forces dominate market sentiment. Despite these concerning indicators, there are several positive signs that may suggest a potential weakening of the downward momentum. The price has approached a significant support level, which could incite buying interest and lead to stabilization. Additionally, the appearance of a long lower shadow on price candles indicates that buyers may be stepping in to support the price at this level, suggesting a potential exhaustion of sellers in the current market environment. Furthermore, the MACD histogram's contraction to -0.2123 hints that the intensity of the bearish momentum may be waning, which could result in a reversal if buying pressure increases. Given the current market conditions, it is advisable for investors to exercise caution and await clear signals of stabilization before making decisive positioning decisions. Watching for patterns of recovery or bullish signals such as higher highs and higher lows could provide opportunities for entering long positions. Alternatively, if the support at 15.275 fails and the downward momentum intensifies, investors may want to consider protective measures to safeguard their portfolios. In conclusion, while the market is presently on a downward trajectory with multiple bearish indicators present, there are glimmers of potential support that merit consideration. The balance of power between buyers and sellers remains fragile at this juncture, and careful monitoring of upcoming price actions will be essential for making informed trading decisions in the weeks ahead. As always, maintaining a disciplined approach amid fluctuating market conditions is vital for navigating this complex environment.
Keywords
 Chainlink
2025-02-27
Blockenza Analysis
Given the current technical analysis and bearish indicators, it suggests the price will likely continue to decline in the near term.
FAQs
1. What is the current price trend of the market?
The market is in a downward trend with prices around 15.246.
2. What are the key technical formations observed?
Notable formations include a breakout to 26 yuan in November, a double top in early December, and a W-bottom in January.
3. What is the critical support level?
The important support level is currently at 15.275.
4. What happens if the price breaches the support level?
If breached, it could signal further downside potential.
5. What do the moving averages indicate?
The moving averages are in a bearish alignment.
6. What are the MACD indicators showing?
All three MACD indicators are negative, suggesting bears are in control.
7. What factors suggest a potential weakening of downward momentum?
The price is nearing support, a long lower shadow has appeared, and the MACD histogram has shortened.
8. What is recommended before making positioning decisions?
It is recommended to wait for stabilization signals.
9. What is the timeframe of the analysis?
The analysis is dated February 27, 2025.
10. How should traders approach the current market?
Traders should observe for stabilization signals before considering any positioning.
Related Articles
In this section, you will find articles and analyses related to this post. These materials will help you gain more information about the topic and develop a broader perspective on the digital currency market. By reading these articles, you can make more informed and precise decisions in your investment journey.

Missed Out on Chainlink? Discover Why Qubetics is the Crypto Coin to Invest in 2025
The cryptocurrency market is evolving rapidly in 2025, offering new investment opportunities. Qubetics is gaining attention as a promising alternative to established names like Bitcoin and Ethereum.
Chainlink
2025-03-11
Astra Nova’s Rapid Rise: $3.5M Funded, Over 210K Gamers Engaged, and a $45 Million Valuation Sparks TGE Excitement
Astra Nova is a dynamic player in the Web3 gaming space, having raised $3.5 million and engaged over 210,000 gamers, leading to a $45 million valuation. Their innovative Black Pass Questing Platform and strategic partnerships signal significant potential in the gaming industry.
Chainlink
2025-03-11

BlockDAG and SpaceDev Partnerships: Navigating Challenges for Solana and Dogecoin
Strong alliances are crucial for the success of blockchain projects, with Solana and Dogecoin facing distinct challenges in the market. While Solana grapples with volatility and Dogecoin suffers from a lack of utility, BlockDAG is effectively enhancing its position through strategic partnerships.
Chainlink
2025-03-11
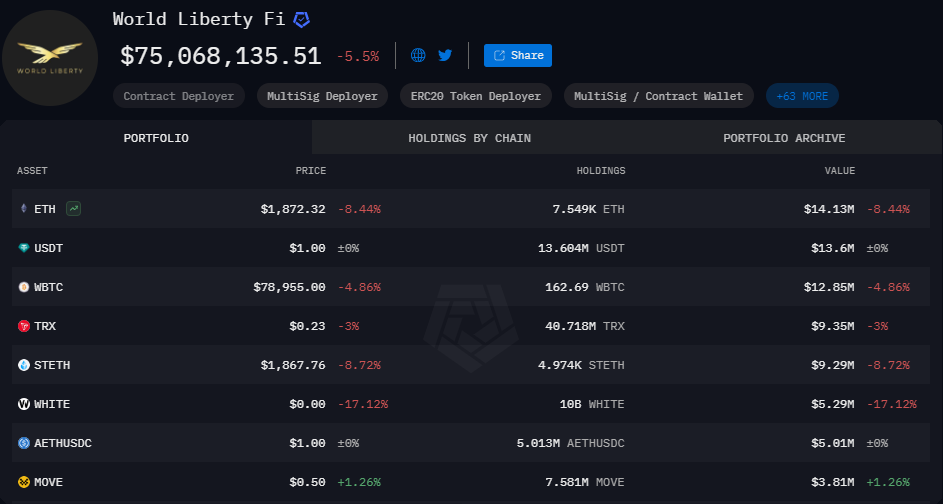
World Liberty Financial Nears Completion of WLFI Tokens Presale
World Liberty Financial is close to finalizing the presale of WLFI tokens, needing only $2 million to proceed to the next stage. The presale has garnered significant interest and is on track for completion, despite potential external market fluctuations.
Chainlink
2025-03-11

Stablecoins Market Capitalization Reaches Historic High of $204.7 Billion
The market capitalization of the top five stablecoins has reached an all-time high of $204.7 billion, indicating a significant shift by investors towards safer, cash-like instruments amidst market uncertainty. This trend reflects a growing aversion to riskier assets and highlights the increasing reliance on stablecoins.
Chainlink
2025-03-11

Chainlink Anticipates Market Recovery with $350 Trillion Opportunity
Sergey Nazarov, Chainlink's founder, predicts a $350 trillion market value for blockchain integration in traditional finance, with significant collaboration efforts in place. Despite a price drop since late 2022, Chainlink's long-term potential remains strong due to partnerships with institutions and government interest in its technology.
Chainlink
2025-03-11