
Technical Analysis of Chainlink as of March 11, 2025
The market displayed upward movement from mid-October to mid-November 2024, followed by declines and range-bound trading into early March 2025. Key resistance and support levels are identified, and indications point toward a continued bearish trend despite potential short-term rebounds.
Article
**Market Analysis: Understanding Candlestick Chart Patterns and Their Implications for Future Trading** In the world of financial trading, one of the vital tools in a trader's arsenal is the candlestick chart pattern analysis. This technique can provide traders with insightful information regarding potential market movements, which is imperative for making informed decisions. Recently, an analysis of market behaviors between mid-October and mid-November 2024 has revealed a fluctuating upward trend followed by some significant pullback in early December. During this period, the market showed signs of strength as prices exhibited an upward climb. Such a trend often suggests increasing buyer confidence, possibly stimulated by positive economic news or investor sentiment. However, this optimism was short-lived, as seen in the notable pullback that occurred in early December. A pullback is a routine correction in price post an upward trend, and it serves to refresh the market before momentum can build up once more. As the market transitioned into early January to mid-February 2025, a different scenario began to unfold. The previous upward momentum was gone, and what we witnessed was a downward trajectory, resulting in a range-bound trading pattern at lower price levels. This behavior highlights the uncertainty present in the market, as prices fluctuate within a confined range without significant breakout potential. One of the critical aspects of the candlestick chart is the identification of support and resistance levels. In this case, a notable resistance level has been established at approximately 26.00, and there’s a relatively robust support level close to 14.00. These levels are crucial for traders as they signify points where price action may either struggle to move beyond (resistance) or find strength to rebound from (support). When prices approach these levels, traders are often keen to adjust their strategies accordingly, either by preparing for a breakout past resistance or getting ready to take profits if there is a strong move toward support. Trading volume is another key factor that informs trading decisions. Peaks and troughs in trading volume can provide insights into market sentiment. For instance, notable trading volume was recorded on December 2, 2024, suggesting a surge in market activity, whereas the lowest trading volume was observed on January 11, 2025. Low volume often points to decreased trader interest, potentially leading to fewer price movements, which could further contribute to the downtrend observed during this time. Additionally, the MACD (Moving Average Convergence Divergence) indicator is crucial for understanding market momentum and trend direction. In this analysis, the MACD indicates a period of weak downtrend, with a DIF value of -1.277 and a DEA value of -1.206. Such readings suggest that there may be momentum behind the downward price movement, albeit weak, and traders should remain cautious. Although there may be potential signals indicating a short-term rebound in the market, the overarching bearish trend cannot be ignored. Downtrends typically attract sellers who may wish to capitalize on continued declines, hence why many traders are advised to approach the market with caution during such times. Generally, understanding candlestick chart patterns presents invaluable insights that can guide trading strategies. Ultimately, remaining vigilant, regularly analyzing market patterns, and adjusting strategies can greatly enhance the chances of success in trading.
Keywords
 Chainlink
2025-03-11
Blockenza Analysis
The market analysis indicates a continued bearish trend with risks of further decline. The score reflects a predominantly negative outlook.
FAQs
1. What is the timeframe of the market analysis?
The analysis covers the period from mid-October 2024 to early March 2025.
2. What was the market trend between mid-October and mid-November 2024?
The market experienced an oscillating upward movement.
3. What happened in early December 2024?
There was a significant pullback in the market.
4. What can be said about the market's performance from January to February 2025?
The market continued to decline and entered a range-bound trading phase.
5. What are the key resistance and support levels?
The key resistance level is around 26.00, and the support level is around 14.00.
6. When did trading volume peak and when did it reach a low?
The trading volume peaked on December 2, 2024, and reached a low on January 11, 2025.
7. What does the MACD indicator suggest?
It suggests the market is in a weak downtrend phase.
8. Is there a possibility of a short-term rebound?
Yes, a short-term rebound may occur.
9. What is recommended for traders at this time?
Cautious operation is advised due to the overall bearish trend.
10. What is the current market analysis score?
The score indicates a bearish outlook with risks of further decline.
Related Articles
In this section, you will find articles and analyses related to this post. These materials will help you gain more information about the topic and develop a broader perspective on the digital currency market. By reading these articles, you can make more informed and precise decisions in your investment journey.

Missed Out on Chainlink? Discover Why Qubetics is the Crypto Coin to Invest in 2025
The cryptocurrency market is evolving rapidly in 2025, offering new investment opportunities. Qubetics is gaining attention as a promising alternative to established names like Bitcoin and Ethereum.
Chainlink
2025-03-11
Astra Nova’s Rapid Rise: $3.5M Funded, Over 210K Gamers Engaged, and a $45 Million Valuation Sparks TGE Excitement
Astra Nova is a dynamic player in the Web3 gaming space, having raised $3.5 million and engaged over 210,000 gamers, leading to a $45 million valuation. Their innovative Black Pass Questing Platform and strategic partnerships signal significant potential in the gaming industry.
Chainlink
2025-03-11

BlockDAG and SpaceDev Partnerships: Navigating Challenges for Solana and Dogecoin
Strong alliances are crucial for the success of blockchain projects, with Solana and Dogecoin facing distinct challenges in the market. While Solana grapples with volatility and Dogecoin suffers from a lack of utility, BlockDAG is effectively enhancing its position through strategic partnerships.
Chainlink
2025-03-11
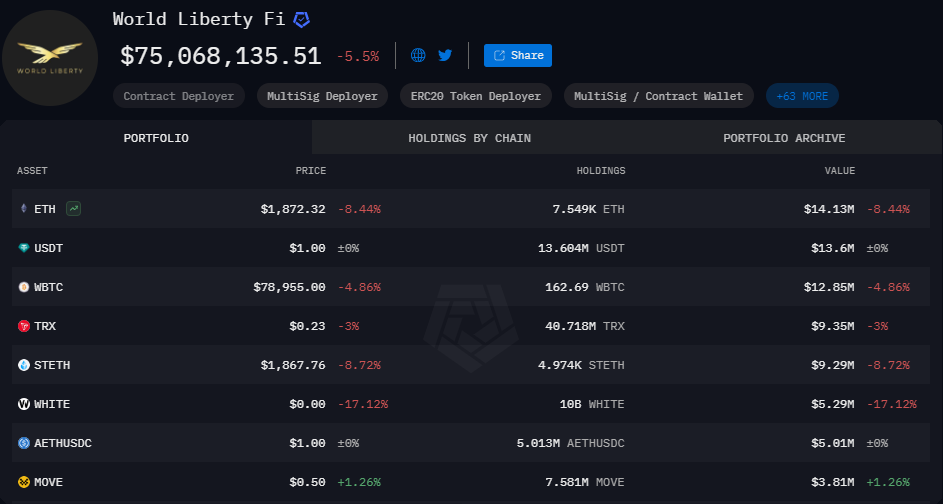
World Liberty Financial Nears Completion of WLFI Tokens Presale
World Liberty Financial is close to finalizing the presale of WLFI tokens, needing only $2 million to proceed to the next stage. The presale has garnered significant interest and is on track for completion, despite potential external market fluctuations.
Chainlink
2025-03-11

Stablecoins Market Capitalization Reaches Historic High of $204.7 Billion
The market capitalization of the top five stablecoins has reached an all-time high of $204.7 billion, indicating a significant shift by investors towards safer, cash-like instruments amidst market uncertainty. This trend reflects a growing aversion to riskier assets and highlights the increasing reliance on stablecoins.
Chainlink
2025-03-11

Chainlink Anticipates Market Recovery with $350 Trillion Opportunity
Sergey Nazarov, Chainlink's founder, predicts a $350 trillion market value for blockchain integration in traditional finance, with significant collaboration efforts in place. Despite a price drop since late 2022, Chainlink's long-term potential remains strong due to partnerships with institutions and government interest in its technology.
Chainlink
2025-03-11