
Technical Analysis of Chainlink from January to March 2025
The market is projected to rise until mid-November 2024, followed by a downward correction expected to begin after January 2025, highlighting key support and resistance levels. Investors should exercise caution as technical indicators suggest ongoing downward movement.
Article
As we delve into the anticipated market movements for the latter part of 2024 and into early 2025, it's essential to understand the dynamics at play. The market is poised for a series of upward fluctuations from early October until mid-November 2024, suggesting a period of uncertainty and potential opportunity for traders. Such fluctuations often result from various economic indicators, investor sentiment, and macroeconomic factors driving market behavior. This volatility offers investors a chance to capitalize on short-term gains, yet it also calls for a cautious approach, as the following correction may lead to more significant declines. Once we transition beyond mid-November 2024, a correction phase is expected to set in. This correction might stem from profit-taking following the earlier upward spikes or broader economic factors such as interest rate adjustments or geopolitical tensions. Investors should note that during such periods, it is common for major economic indicators to influence market sentiment substantially. Thus, keeping an eye on relevant news will be crucial for making well-informed decisions. As we head into 2025, a distinct downward trend is anticipated to establish itself post mid-January. Investors need to prepare for this phase, recognizing that market psychology may shift significantly at this juncture. The rumored preliminary support level at approximately 17.30 suggests that if the market approaches this threshold, we might witness increased buying interest, which could stabilize prices momentarily. However, should this level falter, the situation may lead to deeper declines, especially if the stronger support level around 15 is breached. Conversely, understanding resistance levels is equally paramount. The preliminary resistance level at around 19.80 indicates a potential ceiling that the market struggles to break through. Should the price reach near this level, traders may consider it a trigger point for profit-taking, further reinforcing the reluctance to test higher thresholds. The notable resistance level set at approximately 25 serves as a psychological barrier that the market would need significant bullish momentum to overcome. Looking at historic trading patterns, December 2 and December 12, 2024, marked notable spikes in trading volume, which correlating with upward price movements. Such volume increases often reveal the intensity of market interest and sentiment. The implication of high trading volumes is critical as it demonstrates investor confidence in bullish trends. Conversely, the high-volume declines observed on February 24 and 25, 2025, signal growing bearish sentiment and the potential for momentum to swiftly shift into a downward trajectory. This insight is particularly pertinent for traders looking to calibrate their strategies. Furthermore, the emergence of a "death cross" between the short-term and long-term moving averages is a traditional technical indicator of a looming bear market. Coupled with the negative reading from the MACD indicator, this technical and fundamental analysis suggests a prolonged downward trend may be on the horizon. Such indicators convey that investors ought to exercise considerable caution in their trading strategies as the conditions seem to favor continuing declines. In conclusion, the market outlook from late 2024 into early 2025 demands that investors remain vigilant and adaptable to the ever-changing dynamics at play. By actively monitoring support and resistance levels, adjusting strategies in light of trading volumes and economic indicators, and using technical analysis tools, traders can better navigate the anticipated shifts in momentum. Staying informed and grounded in sound analysis will empower investors to make well-founded decisions in an unpredictable market landscape.
Keywords
 Chainlink
2025-03-01
Blockenza Analysis
The analysis indicates a strong likelihood of continued decline in prices based on technical indicators and market trends. Caution is advised for investors.
FAQs
1. What is the expected market trend from October to November 2024?
The market is expected to experience fluctuating upward movements during this period.
2. What is the anticipated price correction timeframe?
A correction is anticipated after mid-November 2024.
3. What is the preliminary support level for the market?
The preliminary support level is around 17.30.
4. What is the strong support level identified?
The strong support level is around 15.
5. What resistance levels are noted in the analysis?
The preliminary resistance level is around 19.80, with strong resistance around 25.
6. What indicators suggest continued downward momentum?
The 'death cross' formation and a negative MACD indicator suggest ongoing downward momentum.
7. Were there any significant trading volume increases noted?
Yes, increased trading volume was observed on December 2 and December 12 in 2024.
8. What does high-volume decline indicate?
It indicates that the downward momentum is likely to accelerate.
9. What advice is given to investors?
Investors are advised to exercise caution due to the expected market decline.
10. What will happen after mid-January 2025?
A downward trend is expected to establish after mid-January 2025.
Related Articles
In this section, you will find articles and analyses related to this post. These materials will help you gain more information about the topic and develop a broader perspective on the digital currency market. By reading these articles, you can make more informed and precise decisions in your investment journey.

Missed Out on Chainlink? Discover Why Qubetics is the Crypto Coin to Invest in 2025
The cryptocurrency market is evolving rapidly in 2025, offering new investment opportunities. Qubetics is gaining attention as a promising alternative to established names like Bitcoin and Ethereum.
Chainlink
2025-03-11
Astra Nova’s Rapid Rise: $3.5M Funded, Over 210K Gamers Engaged, and a $45 Million Valuation Sparks TGE Excitement
Astra Nova is a dynamic player in the Web3 gaming space, having raised $3.5 million and engaged over 210,000 gamers, leading to a $45 million valuation. Their innovative Black Pass Questing Platform and strategic partnerships signal significant potential in the gaming industry.
Chainlink
2025-03-11

BlockDAG and SpaceDev Partnerships: Navigating Challenges for Solana and Dogecoin
Strong alliances are crucial for the success of blockchain projects, with Solana and Dogecoin facing distinct challenges in the market. While Solana grapples with volatility and Dogecoin suffers from a lack of utility, BlockDAG is effectively enhancing its position through strategic partnerships.
Chainlink
2025-03-11
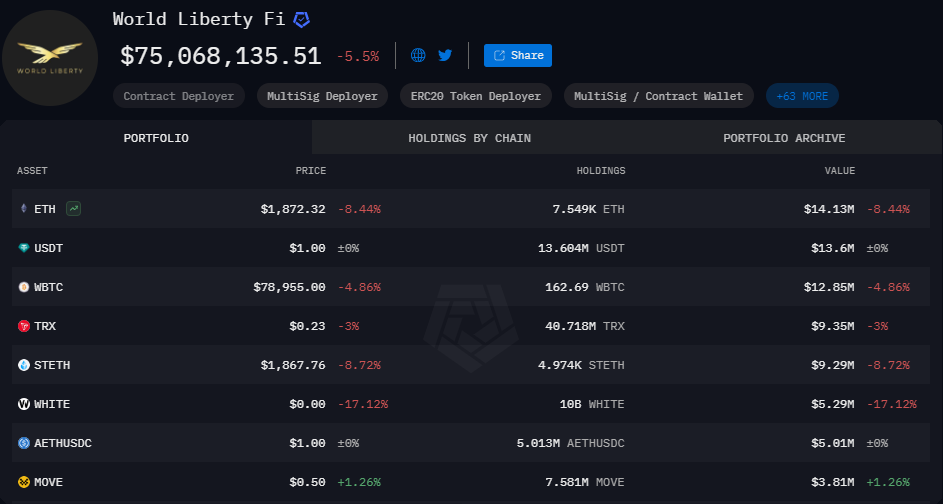
World Liberty Financial Nears Completion of WLFI Tokens Presale
World Liberty Financial is close to finalizing the presale of WLFI tokens, needing only $2 million to proceed to the next stage. The presale has garnered significant interest and is on track for completion, despite potential external market fluctuations.
Chainlink
2025-03-11

Stablecoins Market Capitalization Reaches Historic High of $204.7 Billion
The market capitalization of the top five stablecoins has reached an all-time high of $204.7 billion, indicating a significant shift by investors towards safer, cash-like instruments amidst market uncertainty. This trend reflects a growing aversion to riskier assets and highlights the increasing reliance on stablecoins.
Chainlink
2025-03-11

Chainlink Anticipates Market Recovery with $350 Trillion Opportunity
Sergey Nazarov, Chainlink's founder, predicts a $350 trillion market value for blockchain integration in traditional finance, with significant collaboration efforts in place. Despite a price drop since late 2022, Chainlink's long-term potential remains strong due to partnerships with institutions and government interest in its technology.
Chainlink
2025-03-11