
Technical Analysis of Chainlink on February 26, 2025
The market displays a downward trend, with key formations indicating potential further decline. Investors are advised to be cautious and wait for signs of stabilization.
Article
The financial market is currently witnessing a pronounced downward trajectory, marked by a series of technical patterns that signal potential challenges for investors and traders alike. Notably, a head-and-shoulders top formation was identified between January 17 and January 19, 2024 (UTC), with the neckline situated at 23.3. This pattern often indicates a reversal in the prevailing bullish trend, raising concerns about future price movements and market stability. Following this ominous formation, a double top pattern emerged from late January into early February. This pattern is characterized by two peaks, one at 26.85 and another at 26.37, which suggest a significant resistance level that the market has struggled to maintain. These patterns serve as red flags for market participants, showing that bullish momentum has faltered, and the sellers appear to be gaining control. The situation has intensified as the critical support level of 15.07, established on February 24 (UTC), is nearing a significant breakdown. With the current price hovering around 15.31, it is evident that this key support level is under pressure. The breach of this level could lead to further selling, exacerbating the market's already precarious state. A closer examination reveals that trading volume surged dramatically, peaking at 238.05 coins on February 25 (UTC). This represents a significant increase compared to previous trading volumes and indicates a heightened level of anxiety among traders. Such spikes in volume often accompany increasingly volatile price action, underscoring participants' uncertainty and fear regarding the future direction of the market. In addition to these ominous formations and volume surges, various technical indicators are reflecting a general weakening trend. The moving averages are currently aligned in a bearish formation, reinforcing the notion that the market is in a downtrend. Furthermore, the MACD (Moving Average Convergence Divergence) indicator remains firmly below the zero line, indicative of prevailing bearish momentum. These technical indicators are essential tools for traders as they help in assessing market conditions and potential breakout or breakdown points. Looking ahead, it appears that the market could find some temporary support around the 15.00 mark, a level that may attract some buying interest from bargain hunters or those seeking to capitalize on a potential bounce. However, it is essential to remain cautious, as any rebound from this level is likely to be limited in strength. There is a growing consensus among market analysts that the downward pressure may persist, especially given the ongoing bearish indicators and trader sentiment. In light of the current market conditions, investors are strongly advised to exercise caution. It may be prudent to approach any investment decisions with a wait-and-see mindset, observing for clear signals of stabilization before making further moves. Engaging in a careful analysis of market trends and maintaining a disciplined approach can help mitigate risks in such uncertain environments. Ultimately, the financial markets are inherently unpredictable, and while opportunities may arise even during downturns, the current downward trend, coupled with bearish technical indicators and heightened trading volumes, calls for vigilance and prudence among both novice and experienced investors. As the market navigates through these turbulent waters, staying informed and adaptable remains the key to successful trading and investing strategies.
Keywords
 Chainlink
2025-02-26
Blockenza Analysis
The market is poised for further declines, supported by identified bearish formations and weak technical indicators.
FAQs
1. What trend is the market currently in?
The market is in a clear downward trend.
2. What formations were identified in late January and early February?
A head and shoulders top formation and a double top formation were identified.
3. What is the critical support level mentioned?
The critical support level is 15.07.
4. What unusual trading volume was recorded?
Trading volume reached 238.05 coins on February 25 (UTC).
5. What does the increase in trading volume suggest?
It suggests that panic sentiment among investors has intensified.
6. How are technical indicators performing?
Technical indicators are broadly weakening, with moving averages showing a bearish arrangement.
7. Is a rebound expected in the near term?
A rebound may find support around 15.00, but it is expected to be limited in strength.
8. What should investors do at this time?
Investors should remain cautious and wait for stabilization signals.
9. What are the current price levels?
The current price is 15.31.
10. Is the MACD indicator above or below the zero line?
The MACD remains below the zero line.
Related Articles
In this section, you will find articles and analyses related to this post. These materials will help you gain more information about the topic and develop a broader perspective on the digital currency market. By reading these articles, you can make more informed and precise decisions in your investment journey.

Missed Out on Chainlink? Discover Why Qubetics is the Crypto Coin to Invest in 2025
The cryptocurrency market is evolving rapidly in 2025, offering new investment opportunities. Qubetics is gaining attention as a promising alternative to established names like Bitcoin and Ethereum.
Chainlink
2025-03-11
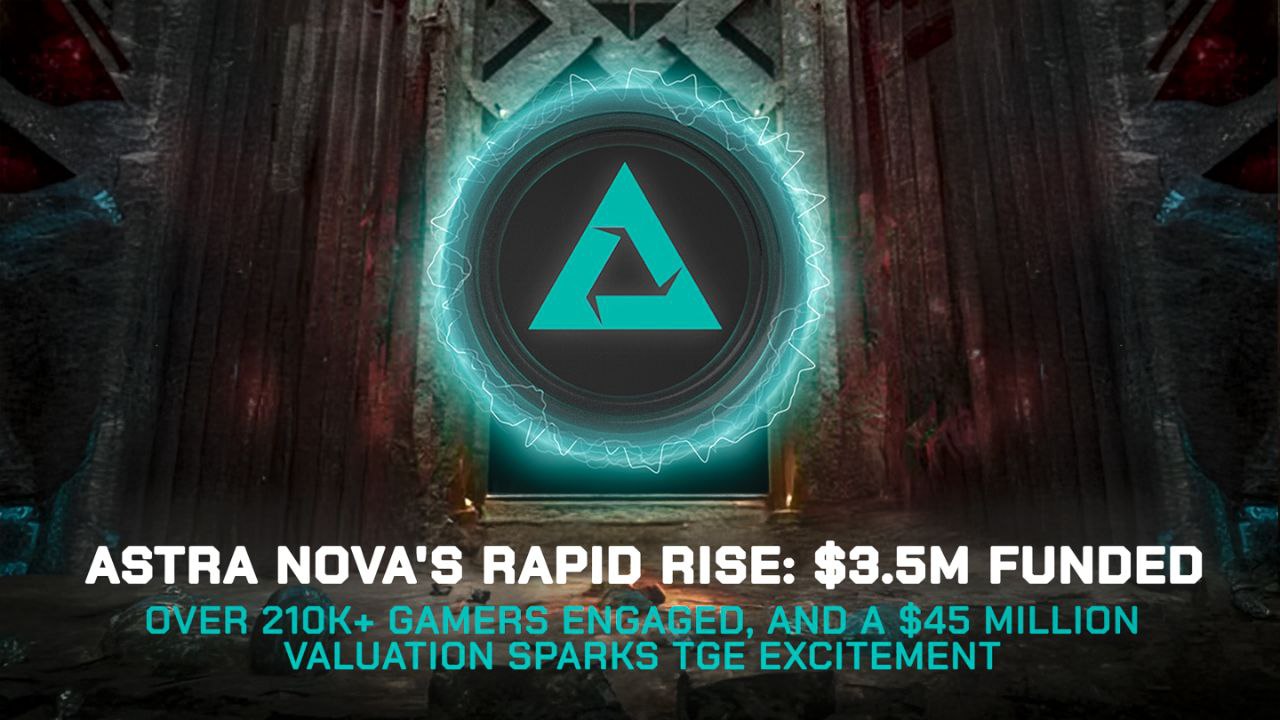
Astra Nova’s Rapid Rise: $3.5M Funded, Over 210K Gamers Engaged, and a $45 Million Valuation Sparks TGE Excitement
Astra Nova is a dynamic player in the Web3 gaming space, having raised $3.5 million and engaged over 210,000 gamers, leading to a $45 million valuation. Their innovative Black Pass Questing Platform and strategic partnerships signal significant potential in the gaming industry.
Chainlink
2025-03-11

BlockDAG and SpaceDev Partnerships: Navigating Challenges for Solana and Dogecoin
Strong alliances are crucial for the success of blockchain projects, with Solana and Dogecoin facing distinct challenges in the market. While Solana grapples with volatility and Dogecoin suffers from a lack of utility, BlockDAG is effectively enhancing its position through strategic partnerships.
Chainlink
2025-03-11
World Liberty Financial Nears Completion of WLFI Tokens Presale
World Liberty Financial is close to finalizing the presale of WLFI tokens, needing only $2 million to proceed to the next stage. The presale has garnered significant interest and is on track for completion, despite potential external market fluctuations.
Chainlink
2025-03-11

Stablecoins Market Capitalization Reaches Historic High of $204.7 Billion
The market capitalization of the top five stablecoins has reached an all-time high of $204.7 billion, indicating a significant shift by investors towards safer, cash-like instruments amidst market uncertainty. This trend reflects a growing aversion to riskier assets and highlights the increasing reliance on stablecoins.
Chainlink
2025-03-11

Chainlink Anticipates Market Recovery with $350 Trillion Opportunity
Sergey Nazarov, Chainlink's founder, predicts a $350 trillion market value for blockchain integration in traditional finance, with significant collaboration efforts in place. Despite a price drop since late 2022, Chainlink's long-term potential remains strong due to partnerships with institutions and government interest in its technology.
Chainlink
2025-03-11