
Technical Analysis of Chainlink on March 10, 2025
The cryptocurrency market is currently in a downward trend, with a potential short-term rebound around resistance levels at 20 and support at 18. A drop below this support may lead to declines toward 15, while MACD indicates weakening bearish momentum.
Article
The cryptocurrency market is presently navigating through a challenging downward trend, which has left many investors and traders grappling with volatility and uncertainty. Despite the current bearish atmosphere, a short-term rebound may be on the horizon. Key resistance points and support levels play critical roles in determining the market's next movements, providing traders with vital information for strategizing their trades. To better understand the situation, it is essential to examine the current price action surrounding significant psychological levels. The resistance level has been pegged around the 20 mark. Traders are keenly watching this threshold since a breakout above it could stir bullish sentiment, potentially leading to an upswing in prices. On the flip side, the support level sits at approximately 18. This level offers a cushion against further declines; however, a slip below this threshold could open the floodgates for additional bearish momentum, possibly dragging prices down to a concerning low of around 15. Instrumental in gauging market sentiment, the Moving Average Convergence Divergence (MACD) indicator currently shows that while bearish momentum is indeed weakening, a clear reversal signal has yet to manifest. Traders often look to the MACD to provide insights into potential price action, with the current observation pointing to a cautious atmosphere surrounding the market. The indicator's signals can serve as alarm bells for traders seeking to know when to enter or exit positions. The trading volume is another critical metric under scrutiny, as it peaked at 601,807 coins on December 2, 2024 (UTC). This heightened trading activity underscores the existence of significant price fluctuations and potential volatility in the market. Increased volume often coincides with price swings, making it an essential factor for traders to monitor closely. A spike in trading volume may indicate market participation is heightened, which could foreshadow impending shifts in price direction. In the short term, the situation remains precarious. The short-term moving average is currently placed beneath the long-term moving average, creating what's known as a bearish crossover. This bearish signal is a traditional indicator of a downtrend and raises caution for traders considering their positions. Investors need to remain vigilant, as aggressive bottom-fishing—attempting to buy at perceived lows in hopes of a rebound—could lead to significant losses if the market continues its downward trajectory. As the cryptocurrency landscape evolves, it is crucial for market participants to adopt a balanced approach. Vigilance while trading is essential, especially given the fluid dynamics of resistance and support levels. Breaching these levels could signal substantial movements in either direction. Traders should stock up on technical analysis skills while also keeping an eye on broader market indicators and news that could affect market sentiment. In conclusion, while the current market sentiment leans towards a bearish phase, opportunities may present themselves for those willing to engage with caution. Monitoring resistance at 20, support at 18, increased trading volume, and MACD signals can better inform trading decisions. As with all investments, understanding the risks involved and preparing for fluctuations will help traders navigate this volatile landscape with greater confidence. As we move forward, it’s vital to adhere to informed strategies, remain patient, and avoid the lure of impulsive decision-making in a rapidly changing environment.
Keywords
 Chainlink
2025-03-10
Blockenza Analysis
The analysis indicates a bearish trend in the cryptocurrency market, suggesting that prices are likely to decline further. The score reflects ongoing downward momentum, although there is some weakening of bearish pressure.
FAQs
1. What is the current trend in the cryptocurrency market?
The cryptocurrency market is currently experiencing a downward trend.
2. Is there a possibility of a price rebound?
Yes, there may be a potential short-term rebound.
3. What is the key resistance level?
The key resistance level is around 20.
4. What happens if the price breaks through 20?
A breakthrough at 20 may lead to a price rebound.
5. Where is the support level located?
The support level is around 18.
6. What could happen if the price falls below 18?
If the price falls below 18, it may decline further to 15.
7. What does the MACD indicator show?
The MACD indicator suggests that bearish momentum is weakening but has not reversed yet.
8. What was the trading volume on December 2, 2024?
On December 2, 2024, the trading volume peaked at 601,807 coins.
9. What do the moving averages indicate?
The short-term moving average is below the long-term moving average, signaling a bearish arrangement.
10. What should traders be cautious about?
Traders should be cautious about bottom-fishing and watch for volume increases and key level breakthroughs.
Related Articles
In this section, you will find articles and analyses related to this post. These materials will help you gain more information about the topic and develop a broader perspective on the digital currency market. By reading these articles, you can make more informed and precise decisions in your investment journey.

Missed Out on Chainlink? Discover Why Qubetics is the Crypto Coin to Invest in 2025
The cryptocurrency market is evolving rapidly in 2025, offering new investment opportunities. Qubetics is gaining attention as a promising alternative to established names like Bitcoin and Ethereum.
Chainlink
2025-03-11
Astra Nova’s Rapid Rise: $3.5M Funded, Over 210K Gamers Engaged, and a $45 Million Valuation Sparks TGE Excitement
Astra Nova is a dynamic player in the Web3 gaming space, having raised $3.5 million and engaged over 210,000 gamers, leading to a $45 million valuation. Their innovative Black Pass Questing Platform and strategic partnerships signal significant potential in the gaming industry.
Chainlink
2025-03-11

BlockDAG and SpaceDev Partnerships: Navigating Challenges for Solana and Dogecoin
Strong alliances are crucial for the success of blockchain projects, with Solana and Dogecoin facing distinct challenges in the market. While Solana grapples with volatility and Dogecoin suffers from a lack of utility, BlockDAG is effectively enhancing its position through strategic partnerships.
Chainlink
2025-03-11
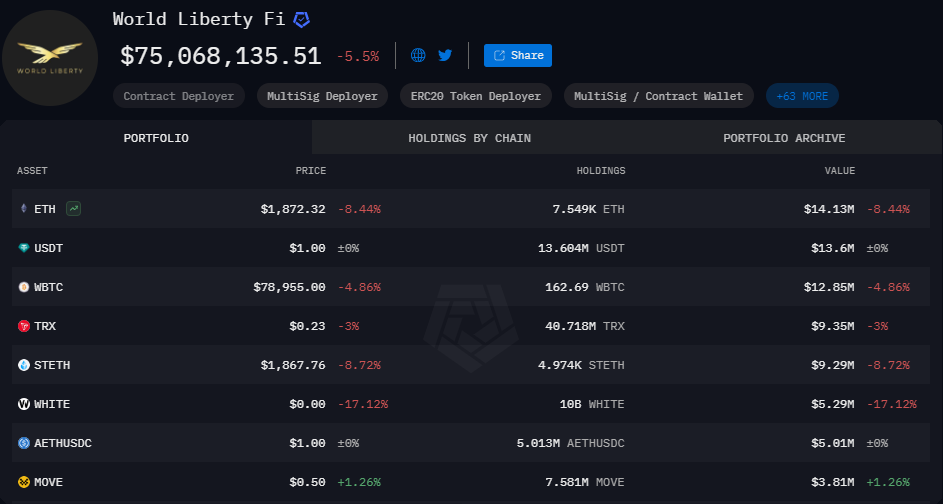
World Liberty Financial Nears Completion of WLFI Tokens Presale
World Liberty Financial is close to finalizing the presale of WLFI tokens, needing only $2 million to proceed to the next stage. The presale has garnered significant interest and is on track for completion, despite potential external market fluctuations.
Chainlink
2025-03-11

Stablecoins Market Capitalization Reaches Historic High of $204.7 Billion
The market capitalization of the top five stablecoins has reached an all-time high of $204.7 billion, indicating a significant shift by investors towards safer, cash-like instruments amidst market uncertainty. This trend reflects a growing aversion to riskier assets and highlights the increasing reliance on stablecoins.
Chainlink
2025-03-11

Chainlink Anticipates Market Recovery with $350 Trillion Opportunity
Sergey Nazarov, Chainlink's founder, predicts a $350 trillion market value for blockchain integration in traditional finance, with significant collaboration efforts in place. Despite a price drop since late 2022, Chainlink's long-term potential remains strong due to partnerships with institutions and government interest in its technology.
Chainlink
2025-03-11