
Technical Analysis of Chainlink on March 8, 2025
Cryptocurrency assets are on a downward trend following an unsuccessful attempt to sustain gains from December 2024. Current resistance and support levels indicate further potential declines if key support areas are breached.
Article
As the world of digital currencies continues to evolve, recent market indicators have painted a somber picture for cryptocurrency investors. Analysis of the latest price movements reveals that cryptocurrency assets are currently on a downward trajectory, raising significant concerns for traders and enthusiasts alike. At the heart of this downturn is the price action seen following a substantial bullish candle in early December 2024. After this brief period of market exuberance, which saw prices surge, the momentum could not be sustained. This led to a marked decline that began in early February 2025, which has been characterized by extreme volatility and bearish sentiment. Examining the price charts, specific resistance levels have emerged as critical thresholds that traders are currently watching. Key resistance points are identified at $27.41, $30.89, and $26.90, corresponding to notable trading dates on December 8, December 13, and December 2, 2024 (UTC). The importance of these resistances cannot be understated; if prices approach these levels again, they may struggle to break through, leading to further sell-offs if they do not hold. On the other side of the spectrum, support levels provide crucial insights into potential price floors. The recently identified support levels of $14.01, $13.09, and $14.23—recorded on February 25, March 4, and March 1, 2025 (UTC)—serve as essential markers for traders assessing the stability of the market. However, it is essential to note that the support level around $18.00 has shown signs of weakening, indicating increased vulnerability in the market. A breach below the significant psychological barrier of $17.00 could exacerbate the situation, potentially leading to an even sharper decline in prices. Notably, on December 2, 2024 (UTC), there was a significant trading volume spike, with 600,000 units exchanged. High trading volumes often suggest strong market interest, yet the current trend indicates that this interest has since waned, contributing to the bearish sentiment. Traders should keep a watchful eye on trading volume fluctuations, as changes can often provide insights into potential reversal points or further declines. Technical indicators are also revealing discouraging signs. The Moving Average Convergence Divergence (MACD) remains firmly in negative territory, measuring a difference (DIF) of -1.025 and a signal line (DEA) of -1.253. Additionally, with a MACD histogram value of 0.2274 as of March 7, 2025 (UTC), the prevailing momentum leans heavily towards the bears. While the possibility of a short-term rebound cannot be entirely dismissed, the dominant overarching trend remains bearish, suggesting that any upticks could be short-lived. As crypto traders navigate these turbulent waters, the prudent approach would be to exercise caution. Risk management strategies such as setting stop-loss orders and maintaining diversified portfolios can help protect against sudden downturns. Furthermore, remaining informed about technological advancements, regulatory developments, and broader market trends is crucial to making sound investment decisions. In summary, current market indicators and technical analyses suggest that caution is warranted as the cryptocurrency market grapples with a downward trend. Investors should remain vigilant, monitoring key price levels and market movements to position themselves wisely in this unpredictable landscape.
Keywords
 Chainlink
2025-03-08
Blockenza Analysis
The analysis indicates a bearish trend in the cryptocurrency market, suggesting that prices are likely to fall further unless significant support levels are regained.
FAQs
1. What is the trend of cryptocurrency assets?
The current trend is bearish, indicating a decline in prices.
2. What happened after the bullish candle in December 2024?
Prices failed to maintain momentum and started to decline in early February 2025.
3. What are the key resistance levels identified?
Resistance levels are at 27.41, 30.89, and 26.90.
4. What support levels should traders watch?
Support levels are at 14.01, 13.09, and 14.23.
5. What does a break below 17.00 imply?
A break below 17.00 may result in further declines in prices.
6. What was the peak trading volume recently recorded?
The peak trading volume reached 600,000 units on December 2, 2024.
7. What does the MACD indicator show?
The MACD indicator remains negative, indicating ongoing bearish momentum.
8. Is a rebound possible in the short term?
A short-term rebound is possible, but the overall trend is bearish.
9. What strategy should traders adopt?
Traders should proceed with caution and closely monitor changes in trading volume.
10. What is the significance of the MACD values?
The values indicate a prevailing bearish market sentiment.
Related Articles
In this section, you will find articles and analyses related to this post. These materials will help you gain more information about the topic and develop a broader perspective on the digital currency market. By reading these articles, you can make more informed and precise decisions in your investment journey.

Missed Out on Chainlink? Discover Why Qubetics is the Crypto Coin to Invest in 2025
The cryptocurrency market is evolving rapidly in 2025, offering new investment opportunities. Qubetics is gaining attention as a promising alternative to established names like Bitcoin and Ethereum.
Chainlink
2025-03-11
Astra Nova’s Rapid Rise: $3.5M Funded, Over 210K Gamers Engaged, and a $45 Million Valuation Sparks TGE Excitement
Astra Nova is a dynamic player in the Web3 gaming space, having raised $3.5 million and engaged over 210,000 gamers, leading to a $45 million valuation. Their innovative Black Pass Questing Platform and strategic partnerships signal significant potential in the gaming industry.
Chainlink
2025-03-11

BlockDAG and SpaceDev Partnerships: Navigating Challenges for Solana and Dogecoin
Strong alliances are crucial for the success of blockchain projects, with Solana and Dogecoin facing distinct challenges in the market. While Solana grapples with volatility and Dogecoin suffers from a lack of utility, BlockDAG is effectively enhancing its position through strategic partnerships.
Chainlink
2025-03-11
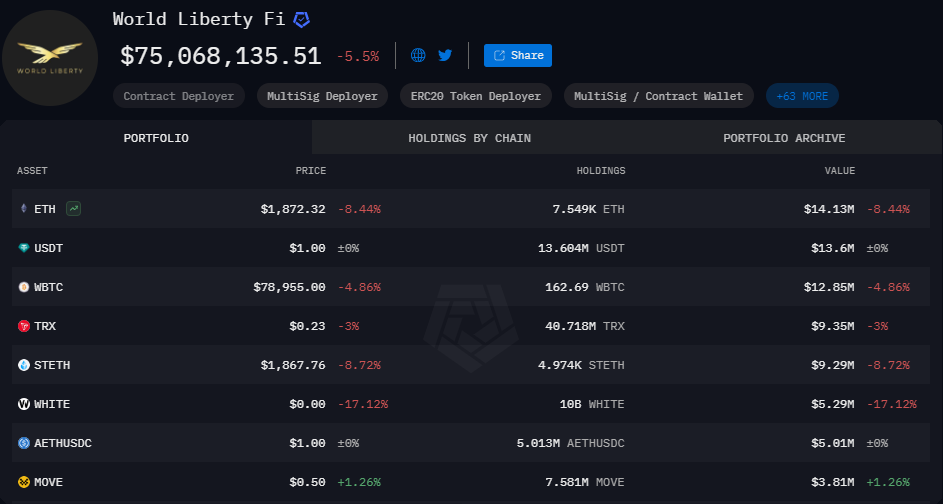
World Liberty Financial Nears Completion of WLFI Tokens Presale
World Liberty Financial is close to finalizing the presale of WLFI tokens, needing only $2 million to proceed to the next stage. The presale has garnered significant interest and is on track for completion, despite potential external market fluctuations.
Chainlink
2025-03-11
Stablecoins Market Capitalization Reaches Historic High of $204.7 Billion
The market capitalization of the top five stablecoins has reached an all-time high of $204.7 billion, indicating a significant shift by investors towards safer, cash-like instruments amidst market uncertainty. This trend reflects a growing aversion to riskier assets and highlights the increasing reliance on stablecoins.
Chainlink
2025-03-11

Chainlink Anticipates Market Recovery with $350 Trillion Opportunity
Sergey Nazarov, Chainlink's founder, predicts a $350 trillion market value for blockchain integration in traditional finance, with significant collaboration efforts in place. Despite a price drop since late 2022, Chainlink's long-term potential remains strong due to partnerships with institutions and government interest in its technology.
Chainlink
2025-03-11